
Map of the Internet. Wednesday, March 2, 2011 - 12:00 UPDATE: See and download our new Map of the Internet App released March 6th, 2013.
Click here. How many hours have you used the Internet today or in an average week? Do you even remember the first time you surfed the Interweb? It wasn’t that long ago when some of us didn’t even know what the Internet was. Internet Mapping Project. Web ranks & stats. Great Map. Physics Simulations and Artwork. Here is a 3D view of a hydrogren atom in the 4f state.
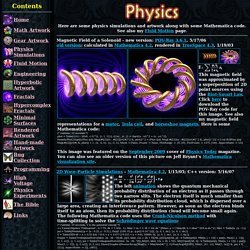
The left image was made in C++ using a technique described by Krzysztof Marczak to make it volumetric like a cloud of smoke. The right image was made in Mathematica by adding 2D cross-sectional layers. The animations were made in POV-Ray using DF3 density files. The right animation shows what a "12o" orbital might look like. Ideas, issues, knowledge, data - visualized!
Web Maps. Data Visualization. 3-Visualizations & mapping. Powers of Ten. Based on the film by Charles and Ray Eames. An Eames Office Website. Visualisation tools resource list, Anthony Judge and Nadia McLaren — The Nautilus Institute. Designer-Data-Visualization-Chart-Infographic-1.png (Image PNG, 972x1000 pixels)