
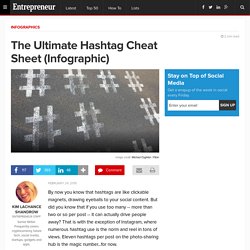
Social Media Study: Top 5 Activities On Twitter, GooglePlus, And Facebook [INFOGRAPHIC] Facebook active users are much more likely to be clicking ‘like’ button than Google plus or Twitter active users are to be hitting +1 or ‘favoriting’.
![Social Media Study: Top 5 Activities On Twitter, GooglePlus, And Facebook [INFOGRAPHIC]](http://cdn.pearltrees.com/s/pic/th/activities-infographic-104393883)
Active Facebookers are also more likely to be interacting with their friends, revels new study from Global Web Index. Consuming content is a favorite activity for many social media users. 35 percent of Twitter users log in to see what's happening without posting/commenting on anything. Take a look at this chart for more insights. Original Post. The Only 10 Slides You Need in a Pitch. Your Content isn’t Going Viral Because it Sucks. As we all get ready to Spring ahead (and that warm weather cannot come soon enough!)
, we’re taking this week to flashback to some of our 2014 blog posts that you may have missed. OnComSelfieInfographic.jpg (JPEG Image, 600 × 2984 pixels) - Scaled (33%) Free presentation template: corporate and professional. Restaurantes y bares venderán 27% más en la celebración del Día de los Amigos. El epicentro de esta fiesta se dará en los bares, discotecas y restaurantes de todo el país, este sector, junto con los vendedores de licores y libros acapararán el consumo durante este mes.
En 2015 el comercio en Colombia registró ventas por $150 billones, se espera que esa cifra crezca significativamente este año con la creación de fechas especiales, como el Día de los Amigos, que se celebra el próximo 14 de marzo y en la que serán protagonistas las productoras y comercializadoras de productos cosméticos, perfumes, licores y libros, gracias a la demanda creciente que tienen al ser los regalos preferidos para dar entre amigos. The Best Ways to Pump Up Your Instagram Strategy (Infographic)
By Kristin Piombino | Posted: February 27, 2015 Instagram users are 58 times more likely to "like," comment on or share a brand's post than Facebook users, and 120 times more likely than Twitter users, an infographic from Salesforce says.
Plus, 58.6 percent of millennial Instagram users in Canada are more likely to remember a brand's Instagram account than they would a television commercial. [RELATED:Become a visual content ninja! Attend our conference on Visual Communications and Infographics.] If your organization is ready to amp up its Instagram strategy—or has yet to create one—this infographic provides helpful guidelines. The next most obvious thing. American Presidents Inaugural Speeches. Visualizing memes : culturegraphy - culture - memes - visualization. Is Instagram Part Of Your Business Marketing Strategy? With over 300 million active monthly users Instagram is becoming harder to ignore.
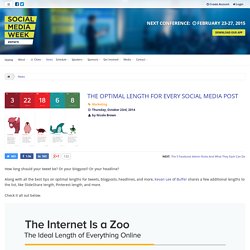
The difficulty most businesses have is just how to use it. It’s a visual medium so you have to have an eye for an image to get it to work for you. That said, Instagram users are 58 times more likely to like, share or comment on a brand’s update than a Facebook user, and 120 times more likely than a Twitter user! Quality and consistency count more than volume, but that is the same for all the social channels. You need to add some fun to your photos, and not be too self-promotional. Hashtags help you get discovered and are a great way to categorize photos over time. Don’t forget to interact, it is not all about you! The Ultimate Hashtag Cheat Sheet (Infographic) By now you know that hashtags are like clickable magnets, drawing eyeballs to your social content.
But did you know that if you use too many -- more than two or so per post -- it can actually drive people away? That is with the exception of Instagram, where numerous hashtag use is the norm and reel in tons of views. Eleven hashtags per post on the photo-sharing hub is the magic number...for now. Sounds like a lot to remember? It can be. Related: #HashtagFails?
On Twitter, tweets bearing hashtags rack up double the engagement (clicks, retweets, replies and favorites). Over on Facebook, where hashtags yielded sluggish engagement at first, hashtagged posts pack .80 percent more viral punch per Facebook Page fan, according to Entrepreneur contributor and KISSMetrics co-founder Neil Patel. Tweet Topic Explorer. New analytic capabilities could transform your business, but you need solid information management to make it a reality. The Optimal Length For Every Social Media Post. How long should your tweet be?
Or your blogpost? Or your headline? Along with all the best tips on optimal lengths for tweets, blogposts, headlines, and more, Kevan Lee of Buffer shares a few additional lengths to the list, like SlideShare length, Pinterest length, and more. Check it all out below. I ❤ data. Culture - Which film will win best picture at the 2015 Oscars? As the ceremony approaches, we crunch the numbers to see if historical data can predict the winning film.
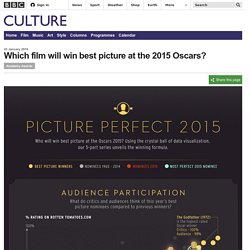
This week: does a movie’s critical and popular rating have an impact? This week we look at whether the critics' and audience views affect a film's chances – and next week we will examine the impact of other award ceremonies like the Golden Globes and the Baftas. Check back to see which movie comes into focus in our crystal ball.