
Travelling salesman problem. The travelling salesman problem (TSP) asks the following question: Given a list of cities and the distances between each pair of cities, what is the shortest possible route that visits each city exactly once and returns to the origin city?
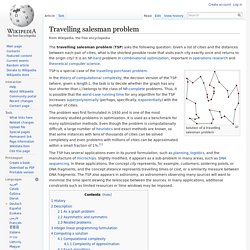
It is an NP-hard problem in combinatorial optimization, important in operations research and theoretical computer science. Solution of a travelling salesman problem TSP is a special case of the travelling purchaser problem. In the theory of computational complexity, the decision version of the TSP (where, given a length L, the task is to decide whether the graph has any tour shorter than L) belongs to the class of NP-complete problems. Thus, it is possible that the worst-case running time for any algorithm for the TSP increases superpolynomially (perhaps, specifically, exponentially) with the number of cities. The problem was first formulated in 1930 and is one of the most intensively studied problems in optimization.
History[edit] Richard M. Since. NP-complete. Although any given solution to an NP-complete problem can be verified quickly (in polynomial time), there is no known efficient way to locate a solution in the first place; indeed, the most notable characteristic of NP-complete problems is that no fast solution to them is known.
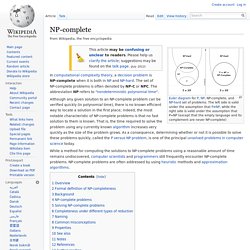
That is, the time required to solve the problem using any currently known algorithm increases very quickly as the size of the problem grows. As a consequence, determining whether or not it is possible to solve these problems quickly, called the P versus NP problem, is one of the principal unsolved problems in computer science today. Overview[edit] Formal definition of NP-completeness[edit] A decision problem is NP-complete if: is in NP, andEvery problem in NP is reducible to in polynomial time.[1] can be shown to be in NP by demonstrating that a candidate solution to can be verified in polynomial time.
Note that a problem satisfying condition 2 is said to be NP-hard, whether or not it satisfies condition 1.[2] RC-Banken eVaR. Der extreme Value-at-Risk (eVaR) erweitert mit bewährten Methoden aus der Naturkatastrophenforschung den Prozess der Aktienselektion, Monitoring und Portfoliokonstruktion um eine zuverlässige Abschätzung der „Tail Risiken“ eines Investmentportfolios.

Mit dem eVaR überstehen Investoren auch stürmische Zeiten an den Finanzmärkten, ohne die Erholungs- oder gar nachhaltigen Wachstumsphasen der Märkte zu versäumen. Oder anders ausgedrückt: Aus Sicht Ihrer Investoren bieten low eVaR Investmentstrategien eine deutliche Reduktion schmerzhafter Verlustperioden, ohne Rendite opfern zu müssen. Neue Herausforderungen an den Finanzmärkten In der Folge extensiver Marktturbulenzen, makroökonomischer Krisen und eines geringen Vertrauens in die Märkte setzt die Investmentindustrie zunehmend auf Lösungen, die über die klassischen Verfahren der modernen Portfoliotheorie nach Markowitz hinausgehen und eine erhöhte Fragilität der Finanzmärkte ins Kalkül ziehen.
Innovative Methoden und Lösungen. A focus on the exceptions that prove the rule. Conventional studies of uncertainty, whether in statistics, economics, finance or social science, have largely stayed close to the so-called “bell curve”, a symmetrical graph that represents a probability distribution.
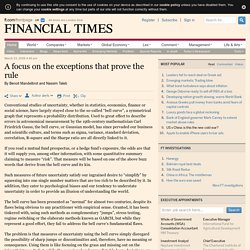
Used to great effect to describe errors in astronomical measurement by the 19th-century mathematician Carl Friedrich Gauss, the bell curve, or Gaussian model, has since pervaded our business and scientific culture, and terms such as sigma, variance, standard deviation, correlation, R-square and the Sharpe ratio are all directly linked to it. If you read a mutual fund prospectus, or a hedge fund’s exposure, the odds are that it will supply you, among other information, with some quantitative summary claiming to measure “risk”. That measure will be based on one of the above buzz words that derive from the bell curve and its kin. The bell curve has been presented as “normal” for almost two centuries, despite its flaws being obvious to any practitioner with empirical sense. Untitled. Diese Seite ist eine HTML-Version eines Posters für die Lange Nacht der Forschung vom 1.
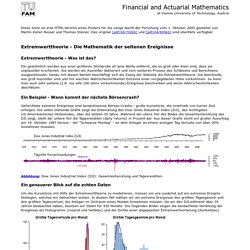
Oktober 2005 gestaltet von Martin Keller-Ressel und Thomas Steiner. Das original [pdf/A0/702kb] und [pdf/A4/695kb] sind ebenfalls verfügbar. Extremwerttheorie - Was ist das? Für gewöhnlich werden aus einer größeren Stichprobe all jene Werte entfernt, die so groß oder klein sind, dass sie unplausibel erscheinen. Sie werden als Ausreißer deklariert und vom weiteren Prozess des Schätzens und Berechnens ausgeschlossen. Ein Beispiel - Wann kommt der nächste Börsencrash? Gefürchtete extreme Ereignisse sind beispielsweise Börsen-Crashs - große Kursstürze, die innerhalb von kurzer Zeit erfolgen. Abbildung: Dow Jones Industrial Index (DJI): Gesamtentwicklung und Tagesrenditen. Ein genauerer Blick auf die echten Daten. Extreme-Value-Theory - EVT Basics. As a consequence of extensive turbulence on the markets, macro-economic crises and dwindling confidence in the markets, the investment industry is increasingly seeking solutions which go beyond the classic processes of Markowitz portfolio theory, and is taking more into consideration the vulnerability of the finance industry to extraordinary happenings.

Innovative methods of title selection and portfolio construction which enable damage-free survival from market turbulences while still reaching the set targets for return, are becoming more and more the focus of the asset manager. Or, to put it another way: they are looking to avoid painful spells of drawdown, without having to forfeit potential profits. Although such ambitions may sound like wishful thinking, the assertions of Benoit Mandelbrot and Nassim Taleb offer a promising starting point for bringing the achievement of this objective a good deal closer.