
A Measurable Strategy on a Single Page. A Measurable Strategy on a Single Page Posted about 12 hours ago Strategy maps, a la the Balanced Scorecard, are the most commonly used visual representation of strategy on a single page.
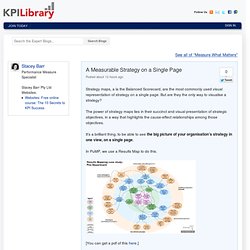
But are they the only way to visualise a strategy? The power of strategy maps lies in their succinct and visual presentation of strategic objectives, in a way that highlights the cause-effect relationships among those objectives. It’s a brilliant thing, to be able to see the big picture of your organisation’s strategy in one view, on a single page. In PuMP, we use a Results Map to do this. [You can get a pdf of this here.] The zones in a Results Maps make cascading and aligning strategy easier.
There are almost always four zones in a Results Map: The pink zone is the middle zone. These zones are arranged in a way that you can see how strategy cascades outwards from the centre, and how people can see alignment from their work through to the organisation’s purpose. There is no place for actions on a Results Map. KPI Examples: Top Call Center Metrics. 21 Key Performance Indicators for Ecommerce Businesses. Key performance indicators are becoming common in large corporations as a way to measure and monitor the success of key activities.
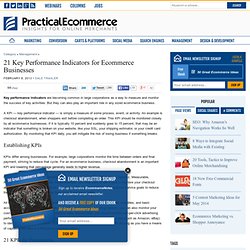
But they can also play an important role in any sized ecommerce business. A KPI — key performance indicator — is simply a measure of some process, event, or activity. An example is checkout abandonment, when shoppers exit before completing an order. This KPI should be monitored closely by all ecommerce businesses. If it is typically 10 percent and suddenly goes to 15 percent, that may be an indicator that something is broken on your website, like your SSL, your shipping estimator, or your credit card authorization. Establishing KPIs KPIs differ among businesses.
For strategic and operational planning, KPIs are also used for SMART goals — Specific, Measurable, Achievable, Realistic, Time-bound. All businesses should regularly monitor their revenue, cash position, receivables, payables, and basic accounting reports. 21 KPIs for Ecommerce What’s a Normal KPI? Do Your Metrics Tell a Story? Do Your Metrics Tell a Story?
Posted 2 days ago This article was also published at The ITSM Review. Do your #metrics tell a story? No? No wonder nobody reads them. That was a tweet I sent a few weeks ago, and it’s had some resonance. Facts are not the only type of data I’ve blogged about metrics a few times before. Go back and read that article to see how it resolved.
I’d love to live in a world where only objective, factual data is considered when making decisions or influencing others; but we have to recognize two important realities: Other types of data, especially personal historical observations that often create biases, are more powerful than objective data ever could be.Your “objective” factual data can actually reduce your credibility, if it is inconsistent with the listener’s personal observations. So, giving reasons to change someone’s mind is not only ineffective, it can also make things worse. We need a reason to care Metrics need to tell a story. The 75 KPIs Every Manager Needs To Know.