
Training Events. DataONE provides training to scientists, students and data managers via presentations, workshops and online resources that covers aspects of managing, preserving, analyzing and visualizing data.
Upcoming Training Events UNM Summer Institute for Environmental Informatics Environmental Information Management: Monday, June 2nd - Friday, June 6th Environmental Data Analysis and Visualization: Monday, June 9th - Friday, June 13th Spatial Data Management in Environmental Sciences: Monday, June 16th - Friday, June 20th University of New Mexico Albuquerque, NM Past Training Events IDCC 2014: DataONE Member Node Implementation Workshop. Infographics & Data Visualizations - Visual.ly.
An Introduction to R. Table of Contents This is an introduction to R (“GNU S”), a language and environment for statistical computing and graphics.
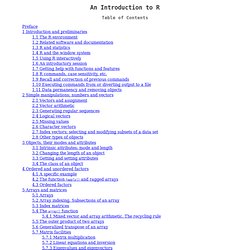
R is similar to the award-winning1 S system, which was developed at Bell Laboratories by John Chambers et al. It provides a wide variety of statistical and graphical techniques (linear and nonlinear modelling, statistical tests, time series analysis, classification, clustering, ...). Features.