
Upswing_data_consumption6202.gif (GIF Image, 620×874 pixels) - S. Coke Datenvisualisierung 2007. Digital Podge 2009 - Measurable Fun. Digital Podge 2009 17th December 2009 Swedish Podge 2010. Information Landscapes. Stamen Design: Illustrating the physics of information. Ben Cerveny of Stamen Designs was speaking before me at the Webtrends Engage conference yesterday.
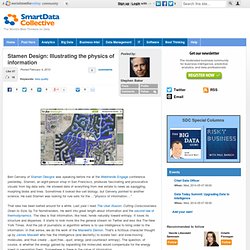
Stamen, an eight-person shop in San Francisco, produces fascinating and provocative visuals from big data sets. He showed data of everything from real estate to news as squiggling, morphing blobs and lines. Sometimes it looked like cell biology, but Cerveny pointed to another science. He said Stamen was looking for rule sets for the ... "physics of information.... " That idea has been batted around for a while. Anyway, Stamen does cool work. This reminds me. PeteSearch. The Man Who Looked Into Facebook's Soul. Youth social networking researcher danah boyd has observed that many people presume the way they use social networks is the way everyone uses them.
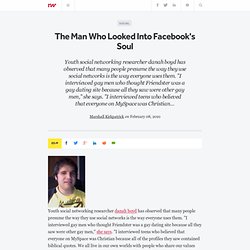
"I interviewed gay men who thought Friendster was a gay dating site because all they saw were other gay men," she says. "I interviewed teens who believed that everyone on MySpace was Christian because all of the profiles they saw contained biblical quotes. We all live in our own worlds with people who share our values and, with networked media, it's often hard to see beyond that.
" Now picture our perspective leaving our own experiences, zooming out and up until we can see how all the different groups are interacting on a worldwide social network. That bird's-eye view could be both beautiful and horrible if the resolution was clear enough. This Wednesday, Warden will make Friend, Fan page and name data from hundreds of millions of Facebook users available to the academic research community. Pulling Down the Facebook Social Graph.
Microsoft Future Data Visualization, 3D Lifelike Experience and. Microsoft Future Data Visualization, 3D Lifelike Experience and more… A picture is worth 1000 words.
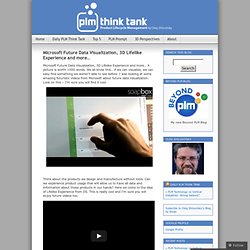
We all know this… if we can visualize, we can easy find something we weren’t able to see before. I was looking at some amazing futuristic videos from Microsoft about future data visualization. Look on this – I’m sure you will find it cool. Think about the products we design and manufacture without tools. Can we experience product usage that will allow us to have all data and information about these products in our hands? Now I’d like to come to some practical ideas we may have tomorrow. 3DVIA Composer.
Like this: Like Loading... Related. Visualization: Table - Google Chart Tools / Interactive Charts ( Overview A table that can be sorted and paged.
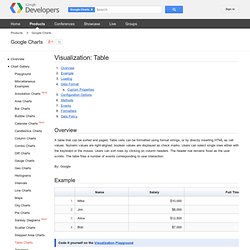
Table cells can be formatted using format strings, or by directly inserting HTML as cell values. Numeric values are right-aligned; boolean values are displayed as check marks. Users can select single rows either with the keyboard or the mouse. Google Fusion Tables. Airspace Rebooted. Note & Point. Designing Visualizations for Time-Based Data - Max Kiesler – Des. Most interaction designers understand the concept of timelines and other time-based data.
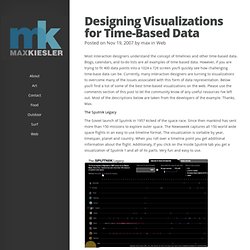
Blogs, calendars, and to-do lists are all examples of time-based data. However, if you are trying to fit 400 data points into a 1024 x 726 screen you’ll quickly see how challenging time-base data can be. Currently, many interaction designers are turning to visualizations to overcome many of the issues associated with this form of data representation. Below you’ll find a list of some of the best time-based visualizations on the web.
Please use the comments section of this post to let the community know of any useful resources I’ve left out. The Sputnik Legacy The Soviet launch of Sputnik in 1957 kicked of the space race. British History Timeline Explore all of British history, from the Neolithic to the present day, with this easy-to-use interactive timeline. Timepiece – Visualize Film Ideas circaVie – Create and Share Timelines Recreating Movement Comment Timeline Visualization. The Sputnik Legacy - Newsweek International - Newsweek.com. Cool Infographics - Cool Infographics. Data Underload #12 – Famous Movie Quotes. Oblong industries, inc. Microsoft Office Labs vision 2019 (montage + video) – istartedso.
[flv:officelabsmontage.flv 600 400] When Microsoft decides to imagine the future, it never fails to impress.
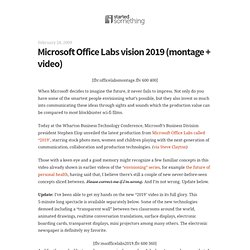
Not only do you have some of the smartest people envisioning what’s possible, but they also invest so much into communicating these ideas through sights and sounds which the production value can be compared to most blockbuster sci-fi films. Today at the Wharton Business Technology Conference, Microsoft’s Business Division president Stephen Elop unveiled the latest production from Microsoft Office Labs called “2019″, starring stock photo men, women and children playing with the next-generation of communication, collaboration and production technologies. (via Steve Clayton) Those with a keen eye and a good memory might recognize a few familiar concepts in this video already shown in earlier videos of the “envisioning” series, for example the future of personal health, having said that, I believe there’s still a couple of new never-before-seen concepts sliced between.
OBLONG INDUSTRIES - Bits Blog. Cool Infographics - Cool Infographics.