
Is not available. Repeated Measures Analysis with Splus/R. Statistical Computing Seminars Repeated Measures Analysis with R There are a number of situations that can arise when the analysis includes between groups effects as well as within subject effects.

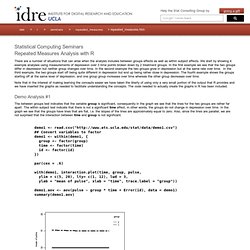
We start by showing 4 example analyses using measurements of depression over 3 time points broken down by 2 treatment groups. In the first example we see that the two groups differ in depression but neither group changes over time. In the second example the two groups grow in depression but at the same rate over time. In the third example, the two groups start off being quite different in depression but end up being rather close in depression. Note that in the interest of making learning the concepts easier we have taken the liberty of using only a very small portion of the output that R provides and we have inserted the graphs as needed to facilitate understanding the concepts.
Demo Analysis #1 Demo Analysis #2 Demo Analysis #3 Demo Analysis #4 Exercise data Further Issues Missing Data Independence. Combining Plots. R makes it easy to combine multiple plots into one overall graph, using either the par( ) or layout( ) function.

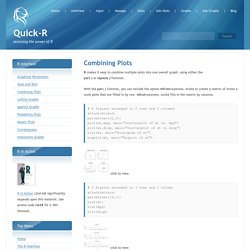
With the par( ) function, you can include the option mfrow=c(nrows, ncols) to create a matrix of nrows x ncols plots that are filled in by row. mfcol=c(nrows, ncols) fills in the matrix by columns. # 4 figures arranged in 2 rows and 2 columns attach(mtcars) par(mfrow=c(2,2)) plot(wt,mpg, main="Scatterplot of wt vs. mpg") plot(wt,disp, main="Scatterplot of wt vs disp") hist(wt, main="Histogram of wt") boxplot(wt, main="Boxplot of wt") click to view # 3 figures arranged in 3 rows and 1 column attach(mtcars) par(mfrow=c(3,1)) hist(wt) hist(mpg) hist(disp) The layout( ) function has the form layout(mat) where mat is a matrix object specifying the location of the N figures to plot. How to choose a random number in R. As a language for statistical analysis, R has a comprehensive library of functions for generating random numbers from various statistical distributions.

In this post, I want to focus on the simplest of questions: How do I generate a random number? The answer depends on what kind of random number you want to generate. Let's illustrate by example. Generate a random number between 5.0 and 7.5 If you want to generate a decimal number where any value (including fractional values) between the stated minimum and maximum is equally likely, use the runif function. > x1 <- runif(1, 5.0, 7.5)> x1[1] 6.715697 Of course, when you run this, you'll get a different number, but it will definitely be between 5.0 and 7.5. If you want to generate multiple random values, don't use a loop.
> x2 <- runif(10, 5.0, 7.5)> x2 [1] 6.339188 5.311788 7.099009 5.746380 6.720383 7.433535 7.159988 [8] 5.047628 7.011670 7.030854 Generate a random integer between 1 and 10 > x3 <- sample(1:10, 1)> x3[1] 4 Further reading > ? An R Introduction to Statistics.
Confidence Interval for Linear Regression. Assume that the error term ϵ in the linear regression model is independent of x, and is normally distributed, with zero mean and constant variance.

For a given value of x, the interval estimate for the mean of the dependent variable, , is called the confidence interval. Problem In the data set faithful, develop a 95% confidence interval of the mean eruption duration for the waiting time of 80 minutes. Solution We apply the lm function to a formula that describes the variable eruptions by the variable waiting, and save the linear regression model in a new variable eruption.lm.