
Homepage. Importing Images to R. 10 tips for making your R graphics look their best. So you've spent hours slaving over the code for a beautiful statistical graphic in R, and now you're ready to show it to the world.
You might be printing it, embedding it in a document, or displaying it on the web. Don't do your graph a disservice by causing it to look anything less than perfect in its final venue. Here are 10 tips to help make sure your graphic will always look best. 1. Call the right device driver from a script It's tempting to just create graphics to the on-screen device (such as X11 on Linux or Quartz on MacOS) and then just use "Save As...
" from the menu. The best practice is to create a script file that begins with a call to the device driver (usually pdf or png), runs the graphics commands, and then finishes with a call to dev.off(). R] Plot ticks and tick labels: thickness, colour? On Wed, 6 Aug 2003, Thomas W Blackwell wrote: > You can certainly make tickmarks thinner than the axis line by > multiple calls to axis() with different values for lwd.
![R] Plot ticks and tick labels: thickness, colour?](http://cdn.pearltrees.com/s/pic/th/ticks-labels-thickness-colour-74489461)
MAYBE > you can overwrite an earlier call by setting col.axis="white" > (and no tickmarks) but I've never tried this. mtext() allows > building custom tick labels. A Community Site for R – Sponsored by Revolution Analytics. Getting-started:installation:packages. Linux/Unix Look at CRAN to determine if a binary version exists for your system.
Otherwise, you still can compile packages from sources. The simplest way to download a package from CRAN and to install it is by using the install.packages() function (make sure you install also all required dependencies). For example, to download and install the package called “mypkg”: install.packages("mypkg", dependencies = TRUE) Of course, this only works if your computer is connected to the Internet and if all tools required to compile packages are installed (see the manual if it fails). Another way of installing a package is in batch mode that is, without starting R you should download the package tarball (i.e. package-name.tar.gz) file you want to install and then issue as root from your usual shell (bash, csh, sh,etc.) and under the same directory in which the tarball is:
Rtips. Revival 2012! Paul E.
Johnson <pauljohn @ ku.edu> The original Rtips started in 1999. It became difficult to update because of limitations in the software with which it was created. Now I know more about R, and have decided to wade in again. In January, 2012, I took the FaqManager HTML output and converted it to LaTeX with the excellent open source program pandoc, and from there I’ve been editing and updating it in LyX.
You are reading the New Thing! The first chore is to cut out the old useless stuff that was no good to start with, correct mistakes in translation (the quotation mark translations are particularly dangerous, but also there is trouble with ~, $, and -. R & Bioconductor - Manuals. R & Bioconductor Manual R Basics Introduction General Overview R ( is a comprehensive statistical environment and programming language for professional data analysis and graphical display.
The associated Bioconductor project provides many additional R packages for statistical data analysis in different life science areas, such as tools for microarray, next generation sequence and genome analysis. Scope of this Manual This R tutorial provides a condensed introduction into the usage of the R environment and its utilities for general data analysis and clustering. Format of this Manual A not always very easy to read, but practical copy & paste format has been chosen throughout this manual.
ISA - Computational Biology Group. Large sets of data, like expression profile from many samples, require analytic tools to reduce their complexity.
The Iterative Signature Algorithm (ISA) was designed to reduce the complexity of very large sets of data by decomposing it into so-called "modules". In the context of gene expression data these modules consist of subsets of genes that exhibit a coherent expression profile only over a subset of microarray experiments. Genes and arrays may be attributed to multiple modules and the level of required coherence can be varied resulting in different "resolutions" of the modular mapping.
Since the ISA does not rely on the computation of correlation matrices (like many other tools), it is extremely fast even for very large datasets. We developed the eisa GNU R package to facilitate the modular analysis of gene expression data. R & Bioconductor - Manuals. ( Slide Show ) R contains many functions and libraries for clustering of large data sets.
A very useful overview of clustering utilities in R is available on the Cluster Task Page and for machine learning algorithms on the Machine Learning Task Page and the MLInterfaces package. Generate a sample data set Data centering and scaling Obtain a distance matrix The basic hierarchical clustering functions in R are hclust , flashClust , agnes and diana . Clustering with hclust # Prints the row labels in the order they appear in the tree. R commands. Specifying Fonts in R. Paul Murrell Department of Statistics The University of Aucklandpaul@stat.auckland.ac.nz This document discusses how R allows fonts to be specified.
This is within the context of R's graphics engine -- graphics systems, such as base graphics and grid can obviously implement their own interfaces, but the engine capabilities will limit what they are able to achieve. Currently (R 1.5.0), the following font characteristics may be set: The base graphics interface provides some extensions on this, basically allowing for multiple cex and font settings to exist for different purposes (e.g., axis labels and titles). One problem with this font specification is that the graphics engine does not provide an easy way to specify a font "family". Another problem is that there is no way to specify a change in inter-line spacing of text (for drawing a single piece of multi-line text, e.g., "one\ntwo\nthree lines") Specifications in other systems Proposal.
YanchangZhao-refcard-data-mining. R] hashmap in R. RGB to Color Name Mapping(Triplet and Hex) An Easy Way to Make a Treemap. Back in 1990, Ben Shneiderman, of the University of Maryland, wanted to visualize what was going on in his always-full hard drive.
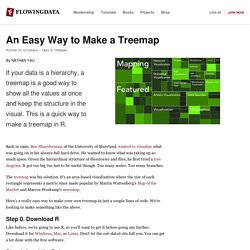
He wanted to know what was taking up so much space. Given the hierarchical structure of directories and files, he first tried a tree diagram. It got too big too fast to be useful though. Too many nodes. Too many branches. The treemap was his solution. Here's a really easy way to make your own treemap in just a couple lines of code. Step 0. Margins / Margin Text. Efg's Research Notes: R TechNotes and Graphics Gallery Purpose This technote explains how to use certain R graphics parameters that deal with margins, namely mar and oma.
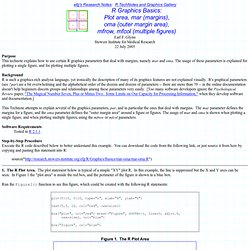
The usage of these parameters is explained for plotting a single figure, and for plotting multiple figures. Background R is such a graphics-rich analysis language, yet ironically the description of many of its graphics features are not explained visually. This Technote attempts to explain several of the graphics parameters, par, and in particular the ones that deal with margins. Software Requirements. Download Revolution R - Free for Academia - Revolution Analytics. Learn, Teach, Research & Help People with the Same Full-Featured Enterprise R Software Used in the Business World Revolution Analytics would like to make it possible for students, educators and organizations working for the public good to have access to the same big data analytics capabilities that are being deployed with great success in the business world.
To this end, we have created three, complementary programs: Individual Scholar Program. Prof. Friedrich Leisch. JRI - Java/R Interface - RForge.net. Dual Category X-Axis (Multi-Level) Memory. One of the most vexing issues in R is memory. R Graphical Manual. Producing Simple Graphs with R.