
Infographics. Periodic Table of Storytelling. I.imgur.com/mtPIswT.jpg. 3847027500_31b74413b2_b.jpg (1024×796) The Way to Personal Branding. Personal Branding is something that a person does to better market themselves and their careers.

This includes defining who you are by finding your skills and passions, establishing how (as a person) you are perceived by others (via personal relationships, professional relationships, and your online reputation) and finally by defining what you want to achieve. This Infographic created by sestyle goes through the whole process step by step to get you on your way to establishing a personal brand for yourself. **Please note that Enfuzed is not responsible for any typographical errors or incorrect information given in any infographics posted on enfuzed.com** About the Author. The Side Effect Of Birth Control No One Talks About. 40 Maps They Didn’t Teach You In School.
By the time we graduate high school, we learn that they never taught us the most interesting things in there.
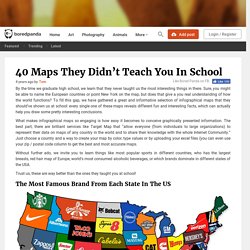
Sure, you might be able to name the European countries or point New York on the map, but does that give a you real understanding of how the world functions? To fill this gap, we have gathered a great and informative selection of infographical maps that they should’ve shown us at school: every single one of these maps reveals different fun and interesting facts, which can actually help you draw some pretty interesting conclusions. Show Full Text What makes infographical maps so engaging is how easy it becomes to conceive graphically presented information. The best part, there are brilliant services like Target Map that “allow everyone (from individuals to large organizations) to represent their data on maps of any country in the world and to share their knowledge with the whole Internet Community.” Trust us, these are way better than the ones they taught you at school! FamousPersonalityTypes_524daae7b512e.jpg (1000×7000)
SETI-infographic-lo-quality.jpg (750×5562) 4108672641_b546d27195_o.png (1728×2304) Infographic: How a landfill works. How A Car Engine Works (animated infographic) BLDGWLF. The-common-cooks-howmany-guide-to-kitchen-conversions_50682c4599d7e.jpg (600×1280) International Networks Archive \\ Remapping Our World. The following six maps deal with an array of major current world issues, from the serious to the seriously frivolous.
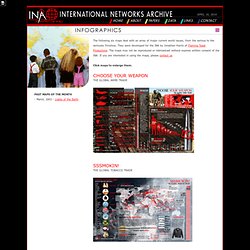
They were developed for the INA by Jonathan Harris of Flaming Toast Productions. The maps may not be reproduced or rebroadcast without express written consent of the INA. If you are interested in using the maps, please contact us. Click maps to enlarge them. This pair of maps show the global presence of Starbucks coffee shops and McDonald's restaurants.
We All Want to be Young. - StumbleUpon. Humans-vs-animals.jpg (1024×724) 12-myths-about-sex.jpg (636×4698) Infographic: 50 Unbelievable Facts About Earth. Stunning Infographics and Data Visualization. Feb 02 2010 Information graphics, or infographics, are visual representations of information, data or knowledge.
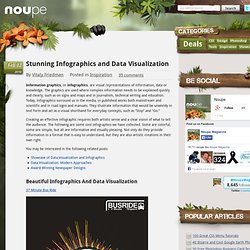
The graphics are used where complex information needs to be explained quickly and clearly, such as on signs and maps and in journalism, technical writing and education. Today, infographics surround us in the media, in published works both mainstream and scientific and in road signs and manuals. They illustrate information that would be unwieldy in text form and act as a visual shorthand for everyday concepts, such as “Stop” and “Go.” Creating an effective infographic requires both artistic sense and a clear vision of what to tell the audience.
You may be interested in the following related posts: Beautiful Infographics And Data Visualization 37 Minute Bus Ride Population of dead Feel Good. Infographed. Thinkmap Visual Thesaurus - An online thesaurus and dictionary of over 145,000 words that you explore using an interactive map. Information is beautiful: 30 examples of creative infography. 640×455 pixels) CS Illustrated: the Characters. PhotOH! Money that speaks for the 99% PhotOH!

Money that speaks for the 99% · Monday, October 17th, 2011 at 12:35 pm You can see more money that speaks for the 99% here, at Occupy George. Brilliant: H/t: @katewarren Speaking of Political Carnival, it's fundrasing time again: Students vs Prisoners.png (PNG Image, 864×1296 pixels) - Scaled (43%) Average Age at first sex by Country. Percentage of People Having Sex Weekly by Country. Infographic-fap-stats-and-statistics.png (PNG Image, 640×1400 pixels) - Scaled (42%) Satisfaction in Having Sex by Country. Current Worldwide Suicide Rate. Every Mission to Mars Ever. True-size-of-africa.jpg (JPEG Image, 2482×1755 pixels) - Scaled (29. e96788364a85e860817c33fa951241ab.jpg (JPEG Image, 800×1236 pixels) - Scaled (47%) Fuck_grapefruit.png from xkcd.com.
Worldclock.swf from poodwaddle.com. Doctor Who Timeline Infographic. Check out this complete timeline of Doctor Who from 1963 to present, including episodes, seasons, companions, villains, and more.

Scroll down to follow all the Doctor's adventures through time. A Fantastic resource for any Doctor Who fan. Adventure Titles An Unearthly Child The Daleks The Edge of Destruction Marco Polo The Keys of Marinus The Aztecs The Sensorites The Reign of Terror Planet of Giants The Dalek Invasion of Earth The Rescue The Romans The Web Planet The Crusade The Space Museum The Chase The Time Meddler Galaxy 4 Mission to the Unknown The Myth Makers The Daleks' Master Plan The Massacre of St. Share on Tumblr Pin It Embed this on your site: <a href=" src=" alt="Doctor Who Timeline Infographic" /></a><br />Via: <a href=" NetflixIG.jpg from sfsignal.com. Qw-cheatsheet-print-zoom.jpg from topatoco.com.
First-contact-alien.png from laboiteverte.fr. Ikea Science Fiction. By Susana Polo | 11:53 am, May 9th, 2011 I could make some joke here about how Ikea directions always make me feel like I’m expected to build something that’s bigger on the inside, but I actually have never had that much trouble following Ikea directions THERE I SAID IT.

Seriously, if you’ve ever put together some Lego sets, you already have all the experience you need. No, the problem I always seem to have is with the furniture where you have to pick up extra parts that aren’t expressly mentioned all over the boxes of the parts you already have, and I find that I’ve left a vital element of a bed, like the bits that hold up the mattress, at the warehouse. And then I sleep on the couch. Sayings-23.jpg from dumpaday.com. Geeky pin numbers. (Image) - Tomash.soup. Tattoo Decision Making Flowchart. 41d43445.jpg from photobucket.com. The Billion Dollar Gram. Capitalism on we heart it / visual bookmark #814886. Münchausen by proxy | We Heart It on the coast of maine.
Add to collections You don't have any collections… Be creative and start beautiful collections to organize your hearts and share with friends. report this entry Reporting an entry If this image belongs to you or is your intellectual property, please submit a copyright notification instead of reporting it. We encourage users to report abusive images and help us moderate the content on We Heart It. If you want to un-heart an image to remove it from your gallery, don't report it. Why are you reporting this entry? War08.sized.jpg from radicalgraphics.org. Food-pyramid.jpg from superpoop.com.
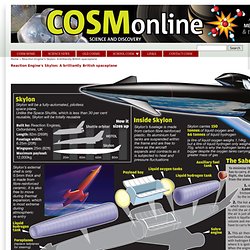
Nobody. Untitled Document. Upcoming?pid=12916 from graphjam.com. (404 error) Yikes! This page doesn't exist. Please choose something else from the Cheezburger menu. World debt comparison: The global debt clock. 605b7d3c66c2dc9470fd939b2011ac0e.png from deviantart.net. Population.jpg from upack.com. Mapping Stereotypes on the Behance Network. Scale-of-universe-v1.swf (application/x-shockwave-flash Object) This is the best way I've ever seen to teach someone evolution. FgDzZ.jpeg (JPEG Image, 1100×7500 pixels) Reaction Engine's Skylon: A brilliantly British spaceplane. Skip to Content Home » Reaction Engine's Skylon: A brilliantly British spaceplane Reaction Engine's Skylon: A brilliantly British spaceplane Bookmark/Search this post with:
1309600677020.png. Maps ETC Homepage. Welcome to ETC's collection of historic maps.
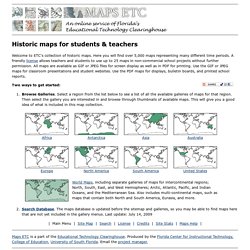
Here you will find over 5,000 maps representing many different time periods. A friendly license allows teachers and students to use up to 25 maps in non-commercial school projects without further permission. All maps are available as GIF or JPEG files for screen display as well as in PDF for printing. Use the GIF or JPEG maps for classroom presentations and student websites. Use the PDF maps for displays, bulletin boards, and printed school reports. Electoral Vote 2008. Since I posted this page originally, the main images have been picked up in Pin-the-Tail StrangeMaps (which has a nice overlay of the cotton and electoral vote maps) Andrew Sullivan Wonkette The Vigorous North (with further explanation tracing this pattern back to the Cretaceous!) Americanworld.gif from demonbaby.com. Map of West Bank / Palestine.
Home - ChartsBin.com. Emergency and Disaster Information Service. Wind Map - Britain Observations. The_World_According_To_Sarah_Palin.jpg?t=1240785689 from photobucket.com. The 2010 Social Networking Map. This post was written by Jenny Urbano, our Social Media Manager. Here at Demandforce, we love seeing and celebrating your ideas! And more than that, we love to hear from YOU.
We want to bridge the gap between us and you, so that’s why we’re offering a once in a lifetime opportunity to win a trip to San Francisco, sightsee in this amazing city, visit Demandforce headquarters and share your ideas with us! 6 winners, and a guest of their choice will be flown out to San Francisco, California on March 12-14th, 2014, where they will stay in Union Square, spend a day at Demandforce, have dinner with the team, and explore the lovely City by the Bay! For contest rules, and how to enter, please visit our post in the Generation Demandforce Community here. ONI Internet Filtering Map. Internet-porn.jpg from onlinemba.com. 2003_Scientific-Productivity.jpg from fastcompany.com. A Virus Walks Into a Bar... and Other Science Jokes - Brian Malow. Height. Insignificant.jpg from mathfail.com. Abstruse Goose & Electromagnetic Leak. 2_Darwin%20tree-11130.html from suntimes.com. When I began as a film critic, Jean-Luc Godard was widely thought to have reinvented the cinema with "Breathless" (1960).
Now he is almost 80 and has made what is said to be his last film, and he's still at the job, reinventing. If only he had stopped while he was ahead. That would have been sometime in the 1970s. Maybe the 1980s. For sure, the 1990s. The thousands of seats in the Auditorium Debussy were jammed, and many were turned away. Continue reading → Robert Hookes Micrographia. 7qPVh.gif from imgur.com. 6248823_61d969584a_o.jpg from zooomr.com. 5001325_orig.jpg?502 from loneatheist.com. A Flowchart to Determine What Religion You Should Follow - Holytaco... DarkAges.gif from nobeliefs.com.
Nonreligion.jpg from hpronline.org. Diagramm,fun,jesus,religion,schaubild,zombies-770a084c7640d3c5282a6cc3d2a962c... Sistine Chapel. Family tree of the Greek gods. Key: The essential Olympians' names are given in bold font. See also List of Greek mythological figures Notes External links Media related to Family trees of Greek mythology at Wikimedia Commons. Seven Deadly Sins Combo Chart. Our-Discussion.jpg from unrforliberty.com. Indirectlyrelated.png from imageshack.us. A Periodic Table of Visualization Methods. The-Holstee-Manifesto.jpg?1285103639 from shopify.com.
What Are The Chances Infographic. How to Build a Pencil Crossbow & JinSpiration. 1797_9350_450.jpeg from soup.io. The Surprising Realities Behind What Motivates Us in Illustrated Form -... @Blueluck: Very true - I've seen other countries where people leave their family in another country to go find work, and then to manual labor for extremely cheap just to be able to send it all home to their family. I guess that could be interpreted as their purpose, but the work is not purposeful in and of itself.
I guess "pay enough to take money off the table" covers that, so we're only talking about how to motivate people after they're at the comfortable level most Americans that read this blog are at.