
Winpdb-reborn. Winpdb Reborn - A GPL Python Debugger, reborn from the unmaintained Winpdb by Philippe Fremy as maintainer, and Nir Aides as initial author Website: Description Winpdb Reborn is a portable (Windows / Linux) standalone graphical debugger for Python.
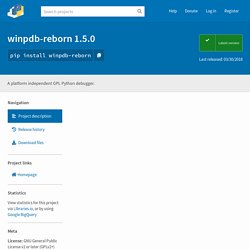
It focuses on making debugging easy and does not include any IDE features. Features: graphical interface with stack/variable inspection, breakpoints and morebreakpoints: on lines or functions, with possible conditions, load/save breakpoint infomulti-threaded debuggingsmart handling of fork, follow parent or childremote debugging: GUI on one computer, program to debug on another computer with encrypted communicationup to 20 times quicker than pdb, the default Python debugger (on which many other debuggers are built)debug PyPy scripts Note: The original Winpdb was no longer maintained since the release v1.4.8 in 2010.
Requirements Platform supported: LinuxWindows XP and aboveMacOs is probably working but not tested To run Winpdb Reborn: Release history. 27.3. pdb — The Python Debugger — Python 3.5.1 documentation. Source code: Lib/pdb.py The module pdb defines an interactive source code debugger for Python programs.
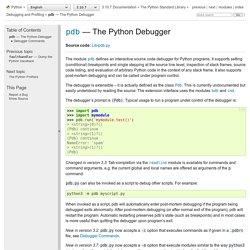
It supports setting (conditional) breakpoints and single stepping at the source line level, inspection of stack frames, source code listing, and evaluation of arbitrary Python code in the context of any stack frame. It also supports post-mortem debugging and can be called under program control. The debugger is extensible – it is actually defined as the class Pdb. This is currently undocumented but easily understood by reading the source.
The debugger’s prompt is (Pdb). >>> import pdb>>> import mymodule>>> pdb.run('mymodule.test()')><string>(0)? Changed in version 3.3: Tab-completion via the readline module is available for commands and command arguments, e.g. the current global and local names are offered as arguments of the p command. Pdb – Interactive Debugger. Pdb implements an interactive debugging environment for Python programs.
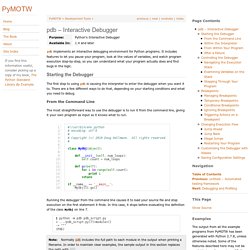
It includes features to let you pause your program, look at the values of variables, and watch program execution step-by-step, so you can understand what your program actually does and find bugs in the logic. Starting the Debugger The first step to using pdb is causing the interpreter to enter the debugger when you want it to. There are a few different ways to do that, depending on your starting conditions and what you need to debug. From the Command Line The most straightforward way to use the debugger is to run it from the command line, giving it your own program as input so it knows what to run. Running the debugger from the command line causes it to load your source file and stop execution on the first statement it finds.
Ipdb 0.9.0. Use ipdb exports functions to access the IPython debugger, which features tab completion, syntax highlighting, better tracebacks, better introspection with the same interface as the pdb module.
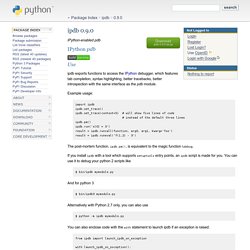
Example usage: import ipdb ipdb.set_trace() ipdb.set_trace(context=5) # will show five lines of code # instead of the default three lines ipdb.pm() ipdb.run('x[0] = 3') result = ipdb.runcall(function, arg0, arg1, kwarg='foo') result = ipdb.runeval('f(1,2) - 3') The post-mortem function, ipdb.pm(), is equivalent to the magic function %debug. If you install ipdb with a tool which supports setuptools entry points, an ipdb script is made for you. . $ bin/ipdb mymodule.py And for python 3 $ bin/ipdb3 mymodule.py. Winpdb - A Platform Independent Python Debugger » About. Winpdb is a platform independent GPL Python debugger with support for multiple threads, namespace modification, embedded debugging, encrypted communication and is up to 20 times faster than pdb.
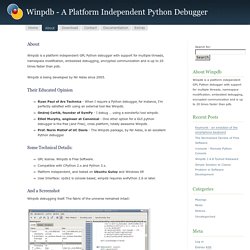
Winpdb is being developed by Nir Aides since 2005. Their Educated Opinion Ryan Paul of Ars Technica - When I require a Python debugger, for instance, I’m perfectly satisfied with using an external tool like Winpdb.Ondrej Certik, founder of SymPy - I debug … using a wonderful tool winpdb.Elliot Murphy, engineer at Canonical - One other option for a GUI python debugger is the free (and Free), cross platform, totally awesome Winpdb.Prof. Norm Matlof of UC Davis - The Winpdb package, by Nir Aides, is an excellent Python debugger. Some Technical Details:
Debugging Python Like a Boss. 26.2. pdb — The Python Debugger. Source code: Lib/pdb.py The module pdb defines an interactive source code debugger for Python programs.
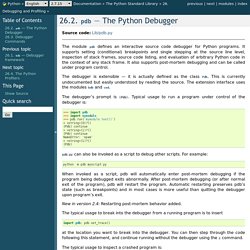
It supports setting (conditional) breakpoints and single stepping at the source line level, inspection of stack frames, source code listing, and evaluation of arbitrary Python code in the context of any stack frame. It also supports post-mortem debugging and can be called under program control. The debugger is extensible — it is actually defined as the class Pdb. This is currently undocumented but easily understood by reading the source.