

Surveys & Programs Listed by Groups.
EDFIN. Percentage distribution of total revenue for public elementary and secondary education in the midwest United States, by revenue source: 1989–90 and 2008–09 U.S.
Department of Education, National Center for Education Statistics, Common Core of Data (CCD), "National Public Education Financial Survey (NPEFS)," fiscal years 1990–2001, Version 1b; fiscal year 2002, Version 1c; fiscal year 2003–2006, Version 1b; fiscal year 2008–2009, Version 1a. Use this site to get finance information on public elementary/secondary education. For summary figures and tables, see the Finance Graphs or for specific public school district finance data, comparisons with other school districts, and school district fiscal and nonfiscal data over time, visit the Data Tools page.
Free single copies of education finance data publications , may be obtained from the Department of Education's, ED Pubs . The following links should be used for questions about: NCES Funding Opportunities Postsecondary Surveys. CSS. CTES. The National Center for Education Statistics' (NCES) Career/Technical Education (CTE) Statistics system derives data about career/technical education primarily from existing NCES surveys.
Some of the most informative data in the CTE Statistics system are from high school transcript data.This method of obtaining data provides a more accurate and complete picture of participation in career/technical education than can be obtained by other means. The CTE Statistics system also uses data from NCES' surveys of postsecondary students and institutions, surveys of secondary schools and faculty, and longitudinal surveys that track secondary and postsecondary students through schooling and into the labor market. The tables provided on this website (see menu list on left) provide NCES' most general statistical information about CTE. BTLS. NHES. ECLS. The Early Childhood Longitudinal Study (ECLS) program includes three longitudinal studies that examine child development, school readiness, and early school experiences.
The birth cohort of the ECLS-B is a sample of children born in 2001 and followed from birth through kindergarten entry. The kindergarten class of 1998-99 cohort is a sample of children followed from kindergarten through the eighth grade. The kindergarten class of 2010-11 cohort is following a sample of children from kindergarten through the fifth grade. The ECLS program provides national data on children's status at birth and at various points thereafter; children's transitions to nonparental care, early education programs, and school; and children's experiences and growth through the eighth grade.
The ECLS program also provides data to analyze the relationships among a wide range of family, school, community, and individual variables with children's development, early learning, and performance in school. B&B. The Baccalaureate and Beyond Longitudinal Study (B&B) examines students’ education and work experiences after they complete a bachelor’s degree, with a special emphasis on the experiences of new elementary and secondary teachers.
DataLab Under law, public use data collected and distributed by the National Center for Education Statistics (NCES) may be used only for statistical purposes. Any effort to determine the identity of any reported case by public-use data users is prohibited by law. Violations are subject to Class E felony charges of a fine up to $250,000 and/or a prison term up to 5 years. NCES does all it can to assure that the identity of data subjects cannot be disclosed.
Use the data in this dataset for statistical purposes only. To proceed you must signify your agreement to comply with the above-stated statutorily based requirements. NAEP. ETS Home. NAAL. The 2003 National Assessment of Adult Literacy is a nationally representative assessment of English literacy among American adults age 16 and older.
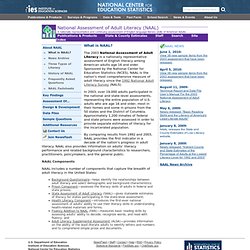
Sponsored by the National Center for Education Statistics (NCES), NAAL is the nation's most comprehensive measure of adult literacy since the 1992 National Adult Literacy Survey (NALS). In 2003, over 19,000 adults participated in the national and state-level assessments, representing the entire population of U.S. adults who are age 16 and older, most in their homes and some in prisons from the 50 states and the District of Columbia. Approximately 1,200 inmates of federal and state prisons were assessed in order to provide separate estimates of literacy for the incarcerated population. By comparing results from 1992 and 2003, NAAL provides the first indicator in a decade of the nation's progress in adult literacy.
NAAL Components. NALS.