
The Geography of iPhone, Android, and Twitter Users in Chicago. Via Kyle VanHemert at Wired, the data mappers at MapBox have produced a fascinating map of the United States by Twitter usage, broken down by phone OS.

Looking at Chicago, some old patterns emerge. Here’s a broad overview, with some annotations on areas of heavier iPhone usage (red) compared to Android (green). It appears that the use of Twitter on iPhones correlates not only with relative wealth, but also with age. It’s concentrated heavily in the Loop, the northwest sides of the city along major diagonal thoroughfares, and colleges. Here’s a bird’s-eye comparison of iOS vs. iPhone use falls off heavily west of Milwaukee Avenue. It’s also prevalent on the West and South sides, in places which seem to be younger (again, this is measured by Twitter use). Austin is, comparatively speaking, a young neighborhood (light blue is 18-35; darker is 35-45, 45-60, and greater than 60). One more. Here, Twitter use runs along familiar racial lines, in the spokes Chicagoans are used to seeing.
Share. Hans Rosling on global population growth. Is the U.S. Population Getting Older and More Diverse?, Alexa Jones-Puthoff, U.S. Census Bureau - Newsroom. Friday, June 14, 2013 at 8:15 a.m.
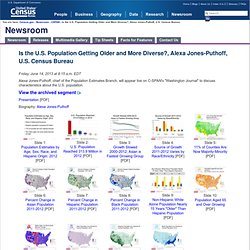
EDT Alexa Jones-Puthoff, chief of the Population Estimates Branch, will appear live on C-SPAN's "Washington Journal" to discuss characteristics about the U.S. population. View the archived segment Presentation [PDF] Biography: Alexa Jones-Puthoff Sources of Information: News Release: Asians Fastest-Growing Race or Ethnic Group in 2012, Census Bureau Reports (en Espanol) Press Kit: National, State, and County Population Estimates by Demographic Characteristics Additional Information: Population Estimates main page Related Segments Population Change in U.S. Nicholas Jones, chief of the Racial Statistics Branch, Appeared on C-SPAN's "Washington Journal" to Discuss Statistics on the Black Population Roberto Ramirez, Chief of the Ethnicity and Ancestry Branch, to Appear on C-SPAN's "Washington Journal" to Discuss Statistics on the Hispanic Population.
Agricultural patterns from space – in pictures. Lapse: Landsat Satellite Images of Climate Change, via Google Earth Engine. TIME and Space | By Jeffrey Kluger Editors note:On Nov. 29, 2016, Google released a major update expanding the data from 2012 to 2016.
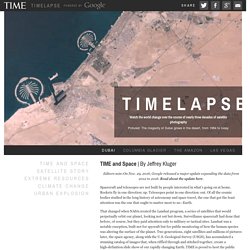
Read about the update here. Spacecraft and telescopes are not built by people interested in what’s going on at home. Rockets fly in one direction: up. Telescopes point in one direction: out. That changed when NASA created the Landsat program, a series of satellites that would perpetually orbit our planet, looking not out but down. Over here is Dubai, growing from sparse desert metropolis to modern, sprawling megalopolis. It took the folks at Google to upgrade these choppy visual sequences from crude flip-book quality to true video footage. These Timelapse pictures tell the pretty and not-so-pretty story of a finite planet and how its residents are treating it — razing even as we build, destroying even as we preserve. Chapter 1: Satellite Story | By Jeffrey Kluger But in 1966, Udall and his staff had an idea. 1 of 20 Aaron Vincent Elkaim / Boreal Collective.
Council of Europe - Live WebTV. The StoryLiv Hambrett. Key geography vocabulary. ITF Latest Publications. Sharing Road Safety: Developing an International Framework for Crash Modification Functions Almost 1.3 million people die in road crashes every year, and between 20 and 50 million are injured.

Road traffic injuries are the leading cause of death among young people between 15 and 29 years of age. Road crashes cost countries between 1 and 3 per cent of their GDP. In the face of these facts, the need for effective road safety policies is undeniable. Governments can more effectively improve road safety by making better use of indicators that reliably quantify the reduction of crashes due to interventions in the road-traffic system. Through the use of indicators - so-called Crash Modification Functions (CMF) that provide measures of how interventions affect the number and gravity of road crashes - governments can reduce the risk of taking decisions that have little or no impact on improving road safety. Other languages: Go to Working Group information. 40 maps that explain the world.
By Max Fisher By Max Fisher August 12, 2013 Maps can be a remarkably powerful tool for understanding the world and how it works, but they show only what you ask them to.
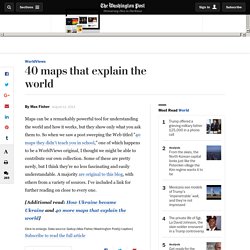
So when we saw a post sweeping the Web titled "40 maps they didn't teach you in school," one of which happens to be a WorldViews original, I thought we might be able to contribute our own collection. Some of these are pretty nerdy, but I think they're no less fascinating and easily understandable. A majority are original to this blog, with others from a variety of sources. I've included a link for further reading on close to every one. [Additional read: How Ukraine became Ukraine and 40 more maps that explain the world] Click to enlarge. All Courses.
Gateway.