
Using Microsoft's Chart Controls In An ASP.NET Application: Getting Started. By Scott Mitchell Introduction A picture is worth a 1,000 words...
This adage rings especially true when it comes to reporting. Charts summarize and illuminate patterns in data in a way that long tables of numbers simply cannot. Web developers have long searched for ways to express numerical data in a graphical format; until recently, doing so required the use of an open source or third-party charting or reporting package or some homegrown technique using HTML, GDI+, or some other technology. The Microsoft Chart Controls are an encompassing set of charts for WinForms and ASP.NET applications. While the Microsoft Chart Controls have some rough edges, their cost (free), number of chart types, and array of supported charting features make them an excellent choice for adding charts to an ASP.NET web application.
Downloading and Installing the Microsoft Chart Controls The files to download follow: Adding a Chart to an ASP.NET Page The Main Components of a Chart Specifying Chart Data Until then... Chart Controls for .NET Framework Forum. Microsoft Chart with ASP.NET 3.5 – Part 2. In this article (Part 2) the MS Chart control will be bound to the SqlDataSource created in Part 1.
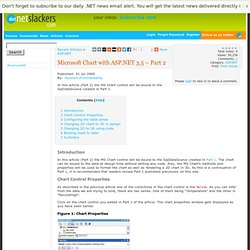
Introduction In this article (Part 2) the MS Chart control will be bound to the SqlDataSource created in Part 1. The chart can be bound to the data at design time without writing any code. Also, the MS Chart’s methods and properties will be used to format the chart as well as rendering a 2D chart in 3D. As this is a continuation of Part 1, it is recommended that readers review Part 1 published previously on this site. Chart Control Properties As described in the previous article one of the collections in the chart control is the Series.
Click on the chart control you added in Part 1 of the article. Figure 1: Chart Properties The data source we added SqlDataSource1, becomes the data source of the chart. New ASP.NET Charting Control: <asp:chart runat="server"/> Microsoft recently released a cool new ASP.NET server control - <asp:chart /> - that can be used for free with ASP.NET 3.5 to enable rich browser-based charting scenarios: Once installed the <asp:chart/> control shows up under the "Data" tab on the Toolbox, and can be easily declared on any ASP.NET page as a standard server control: <asp:chart /> supports a rich assortment of chart options - including pie, area, range, point, circular, accumulation, data distribution, ajax interactive, doughnut, and more.
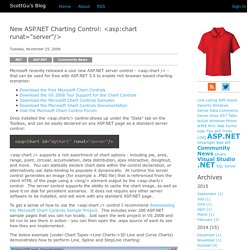
You can statically declare chart data within the control declaration, or alternatively use data-binding to populate it dynamically. At runtime the server control generates an image (for example a .PNG file) that is referenced from the client HTML of the page using a <img/> element output by the <asp:chart/> control. The server control supports the ability to cache the chart image, as well as save it on disk for persistent scenarios. Hope this helps, Scott.