
Density Design. Online. Managing the virtual workforce. Creative Infographic Design & Information Graphics. Catalog Dashboard. Ideas, issues, knowledge, data - visualized! Tetherless World. Download. Choose your operating system: TheBrain 8 for Mac OS X Mac OS 10.7+1 GHz Intel Processor, 1GB RAM, 100 MB available storage TheBrain 8 for Linux Works on many Linux/Unix variants.

Verified on Ubuntu, Red Hat, Fedora, Solaris, and SUSE.We are unable to support all installations of TheBrain for Linux due to the number of possible unique configurations and low number of users.1 GHz CPU, 1GB RAM, 100 MB available storage Archive format without an installer (For experts only) TheBrain for iOS TheBrain for iOS is a native app for iPad, iPhone, and iPod TouchAccess your Brain on your iOS device, on the Web and from your desktop computer with TheBrain Cloud ServicesLearn more about TheBrain for iOS. TheBrain for Android TheBrain for Android is a native app for Android devices.Access your Brain on your Android device, on the Web and from your desktop computer with TheBrain Cloud ServicesLearn more about TheBrain for Android.
How the Free Download Works Getting Started with TheBrain. TimeCult. Graphdrawing.org. 20 Useful Visualization Libraries. Infographics & Visualizations. Create, Share, Explore. Cool Infographics - Blog. Teaching With Infographics. Earlier this week I learned from Larry Ferlazzo that The New York Times Learning Network was doing a series of posts about teaching with infographics.

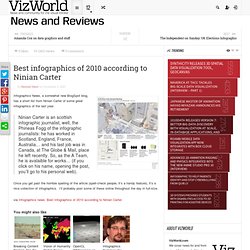
The last installment of the series went live today with a post by Diana Laufenberg. Diana's post includes ten steps for designing lessons in which students create infographics. Her post also includes links to some valuable information concerning the actual infographic design process. The entire Teaching With Infographics series contains a lot of very useful information for teachers who are considering using infographics in their classrooms. Infographics. Infographics News, a somewhat new BlogSpot blog, has a short list from Ninian Carter of some great infographics of the last year.
The KnotPlot Site. Polymaps. Online Diagram Software and Flowchart Software - Gliffy. Online Mind Mapping - MindMeister. Data Visualization: Modern Approaches - Smashing Magazine. About The Author Vitaly Friedman loves beautiful content and doesn’t like to give in easily. When he is not writing or speaking at a conference, he’s most probably running … More about Vitaly Friedman … Data presentation can be beautiful, elegant and descriptive.
There is a variety of conventional ways to visualize data - tables, histograms, pie charts and bar graphs are being used every day, in every project and on every possible occasion. How To Create Outstanding Modern Infographics. In this tutorial you will learn that data doesn't have to be boring, it can be beautiful!

Learn how to use various graph tools, illustration techniques and typography to make an accurate and inspiring infographic in Adobe Illustrator. Start by using the Rectangle Tool (M) to draw a shape. Give it a subtle radial gradient too. The entire design is based on a grid of four columns. To make the columns first select the rectangle and drag a guide onto the centre of the shape. Condense the shape so it fits within the left-most guide and centre guide. Move the shape over to the right and add another guide to the centre here. Using the Rectangle Tool (M) draw a thin white box on the centre line that will be the width of the gap between the columns. Repeat the process for the other columns with your final result being below. I like to place the most important graphics first and work-in the ancillary charts and graphs afterwards. Give the circles a variety of gradients.
Thinkmap visualization software facilitates communication, learning, and discovery. Diagramly – A Handy Tool For Creating Quick Flowcharts. The best thing about Diagramly is how accessible it is.

You just click a URL, and you’re in. There’s no download, no account registration, and you don’t even need Flash to use it. It really couldn’t be simpler to get started. The worst thing about Diagramly (I’ll just get this out of the way right now) is the utter lack of documentation. For example, check out this diagram I made for you, showing the ideal MakeUseOf reader’s workflow: Pretty easy to understand, right? Let’s take a look at the UI: I included Chrome’s address bar on purpose, so you’d see it really is a Web app. Here are just a few samples I picked at random: Why there is a Shield of David there, I have absolutely no idea.
Once you’re done crafting your masterpiece, you can save it in one of a number of formats: Saving as an SVG is very handy if you have a desktop vector editing application (such as the free and open-source Inkscape). 10 Awesome Tools To Make Infographics. Advertisement Who can resist a colourful, thoughtful venn diagram anyway?

In terms of blogging success, infographics are far more likely to be shared than your average blog post. This means more eyeballs on your important information, more people rallying for your cause, more backlinks and more visits to your blog. In short, a quality infographic done well could be what your blog needs right now.
Designing An Infographic.