
Data Visualization "Quadrant" For many years, Gartner keeps annoying me every January by publishing so called “Magic Quadrant for Business Intelligence Platforms” (MQ4BI for short) and most vendors (mentioned in it; this is funny, even Donald Farmer quotes MQ4BI) almost immediately re-published it either on so-called reprint (e.g. here – for a few months) area of Gartner website or on own website; some of them also making this “report” available to web visitors in exchange for contact info – for free.
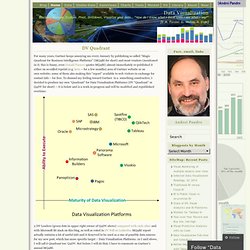
To channel my feeling toward Gartner to a something constructive, I decided to produce my own “Quadrant” for Data Visualization Platforms (DV “Quadrant” or Q4DV for short) – it is below and is a work in-progress and will be modified and republished overtime: 3 DV Leaders (green dots in upper right corner of Q4DV above) compared with each other and with Microsoft BI stack on this blog, as well as voted in DV Poll on LinkedIn. Permalink: Like this: Forrester - ADV - A Critical BI Component. As one of the industry-renowned data visualization experts Edward Tufte once said, “The world is complex, dynamic, multidimensional; the paper is static, flat.

How are we to represent the rich visual world of experience and measurement on mere flatland?” Indeed, there’s just too much information out there for all categories of knowledge workers to visualize it effectively. More often than not, traditional reports using tabs, rows, and columns do not paint the whole picture or, even worse, lead an analyst to a wrong conclusion. Firms need to use data visualization because information workers: Cannot see a pattern without data visualization. ADV Makes BI Stand Out. Visualization-based data discovery tools.
Visualization-based data discovery tools may account for less than 5 % of the Business Intelligence (BI) Market, but they are fighting above their weight in terms of profile.
In 2011, Gartner placed Visualisation at the peak of the BI Hype Cycle. Despite this indicating the category may lose some of its lustre , Gartner are still predicting a compound annual growth rate of 30% in each of next 5 years. If true, this means the category will increase in value from $427 to $1,606 million over the period, a growth rate 3 times that of the overall BI market.
So what are Data Visualisation tools and how are they defined? According to Gartner, there are 3 common elements.