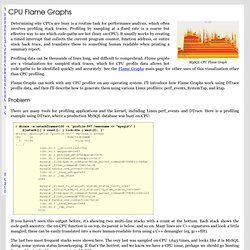

TCP Tuning. CPU Flame Graphs. MySQL CPU Flame Graph Determining why CPUs are busy is a routine task for performance analysis, which often involves profiling stack traces.

Profiling by sampling at a fixed rate is a coarse but effective way to see which code-paths are hot (busy on-CPU). It usually works by creating a timed interrupt that collects the current program counter, function address, or entire stack back trace, and translates these to something human readable when printing a summary report. Profiling data can be thousands of lines long, and difficult to comprehend. Flame graphs are a visualization for sampled stack traces, which for CPU profile data allows hot code-paths to be identified quickly and accurately. About OProfile. Overview OProfile is a system-wide profiler for Linux systems, capable of profiling all running code at low overhead.

OProfile is released under the GNU GPL.
Applications Benchmarking. Disk & I/O Benchmarking. SystemTap. Website performance.