
Teaching Experimental Design. Data Anaysis and Stat. Many of the lessons linked below were written by pre-service teachers in classes and in-service teachers in workshops conducted by Dr.
Antonio Quesada, at the University of Akron (Ohio). To the best of our knowledge, the lessons are original work; materials used from other sources are cited within the lessons. Lessons are labeled, whenever possible, to indicate technology used within the lesson. Leila Schneps: Mathematics in Forensic Science. Mathematics is fast becoming one of the most important techniques in crime detection.
Where once a Sherlock Holmes would have had to be content with a magnifying glass, or a jury with gut instinct and rational discussion, now a range of methods from probability and statistics are available to help. Today, mathematics lies behind expert conclusions on a hundred forensic matters from fingerprints to DNA. Statistics can be a precious tool when identifying the patterns behind confusing or misleading phenomena. The University of California at Berkeley was sued for gender bias when it was observed that just 35 percent of female applicants to graduate school were being accepted, versus 44 percent of males.
Activity : Hypothesis Testing: Means: Statistics: TI Math. Education.ti.com/xchange/US/Math/Statistics/10239/HypothesisTestingMeans_Student.pdf. Lines and Lines of Tangency. In my last post we considered the question of whether Double Stuf Oreos actually live up to their name, creme-wise.
Chris Danielson and I have been going back and forth over the use of nutritional info alone to justify crying foul against the National Biscuit Company. Enough of that. Let’s do some science. Before taking any measurements, I decided it was only fair to ask Nabisco upon precisely what basis they make their claim of “double.” I mean, I didn’t want to be comparing masses if “double” refers to volume. On the altar (dining room table) of science: one package standard Oreo cookies, one package Double Stufs, one Flinn Scientific OB2057 digital scale (accurate to ± 0.05g), one research assistant (girlfriend) with iPad. 30 carefully excised Double Stuf cremes. What are the chances? If you have never read The Hunger Games I would say, "Read It!
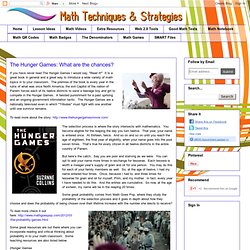
" It is a great book in general and a great way to introduce a wide variety of math topics in to your classroom. The premise of the book is every year in the ruins of what was once North America, the evil Capitol of the nation of Panem forces each of its twelve districts to send a teenage boy and girl to compete in the Hunger Games. A twisted punishment for a past uprising and an ongoing government intimidation tactic. The Hunger Games are a nationally televised even in which "Tributes" must fight with one another until one survivor remains. To read more about the story: Correlation and Scatterplots. PatrickDooleyDHS - AP Statistics. AP Statistics Notes. Pdfurl=1qeXpurpn6Wih-SUpOGumqWnh8DU18jc0dPXkrzi1dre4NnV0umF69HZ2JK83uPY6eCFsefX0uTUyuOUpOGul6-Py46q6Z-pnZ-S2t3i5KCknNzj5qiT3dve1aDQz-jL2NWT0dPrlOfcxuTb3OLdyeic1c3f29fnl5Wkn5ufotbZ04en7A.
Design of Experiments project - 2012 - Statistics for Engineering. From Statistics for Engineering This DOE (design of experiments) mini-project gives you an opportunity to learn about designed experiments in a more hands-on manner.
The project is not long, and should not be elaborate. You only have a few weeks to plan your experiments, perform them and then analyze the data. Some more examples are given below, but it could be something like optimizing a favourite recipe or dessert, a hobby or sport, or it could be related to work from another course project or your graduate research, which is ideal for 600-level students, or 400-level students doing research projects. The intention is that you discover for yourself how important the following topics are in DOE.
Which variables should we use? These are issues that are not easily reproduced or understood from assignment questions and exams. You might be passionate about your hobby, for cooking, or your research area, etc, so coming up with a system to investigate shouldn't be a problem. Course: Statistics. The Assessment Challenge in Statistics Education - IASE - The International Association for Statistical Education. Activities - Statistics and Probability - Teach Maths. Free-statistics-ebooks. Floating descriptive stats. American Statistical Association. One of the goals of the American Statistical Association is to improve statistics education at all levels.
Through the STatistics Education Web (STEW), the ASA is reaching out to K-12 mathematics and science teachers who teach statistics concepts in their classrooms. STEW is an online resource for peer-reviewed lesson plans for K-12 teachers. The web site is maintained by the ASA and accessible to K-12 teachers throughout the world. Statistics and probability concepts are included in K-12 curriculum standards, in particular the Common Core State Standards, and on state and national exams; however, few K-12 teachers have formal training or applied experience with statistical concepts. K-12 teachers need a place where they can find peer-reviewed teaching materials available in a standard format. STEW lesson plans identify both the statistical concepts being developed and the age range appropriate for its use.
Lesson Plans. Dl.dropbox.com/u/59433434/104-project-rubric.pdf. Www.ma.hw.ac.uk/~stan/aod/writing.pdf. American Statistical Association. With so many web sites available, it is hard for teachers of statistics to select those that are most useful.
The following is a compilation of information by members of the ASA/NCTM Joint Committee on the Curriculum in Statistics and Probability. You may wish to visit these sites and see which are appropriate for your teaching level. General Sites. V6N3: Smith. Gary Smith Pomona College Journal of Statistics Education v.6, n.3 (1998) Copyright (c) 1998 by Gary Smith, all rights reserved.
This text may be freely shared among individuals, but it may not be republished in any medium without express written consent from the author and advance notification of the editor. Key Words: Activity-based learning; Introductory statistics; Learning by doing; Team projects. To help students develop statistical reasoning, a traditional introductory statistics course was modified to incorporate a semester-long sequence of projects, with written and oral reports of the results. 1 A radical reform of introductory statistics classes has been advocated by many, often motivated by observations similar to Hogg (1991): "students frequently view statistics as the worst course taken in college. " 2 For most of my 25 years teaching statistics, I have felt that my role is to give clear lectures that transmit information from the expert (me) to the novices (students).
NLVM 9 - 12 - Data Analysis & Probability Manipulatives. V1N1: Teaching Bits.
PBL in Stats. Www2.isye.gatech.edu/statistics/papers/04-21.pdf. Www.public.iastate.edu/~wrstephe/stat101/helicopterproject.pdf. High Tech High - Project Based Learning. Timeline Introducing the Unit: The Drug Unit begins with an introduction to the educational digital video project. Instructors explain the educational digital video project, the project requirements, and the project timeline to the students. The project timeline, rubric, project organizer, sample story board, blank story boards, and contest entry form will be handed out at this time. After the project overview, the instructors will show sample educational anti-drug videos that students have made in the past. Instructors will also show the slides form the school wide viewing of the movies from last year. The curriculum standards are taught around these main dates and are uniquely taught at moments when students need information in order to accomplish the timeline below.
Open Learning Initiative. Type-i-and-type-ii-errors.jpg (960×720) Preface. Play-statistics. Seminar Series. Introductory Statistics. About the Authors Douglas S.
Shafer Douglas Shafer is Professor of Mathematics at the University of North Carolina at Charlotte. In addition to his position in Charlotte he has held visiting positions at the University of Missouri at Columbia and Montana State University and a Senior Fulbright Fellowship in Belgium.