
Analysis of ongoing, evoked, and induced neuronal activity: Power spectra, wavelet analysis, and coherence [NBTwiki.net] We now turn to the classical analysis of longer segments of ongoing activity, which to a large extent is the activity that we averaged away in the tutorial on averaged evoked responses, namely oscillations that are not phase-locked to the stimulus onset.
![Analysis of ongoing, evoked, and induced neuronal activity: Power spectra, wavelet analysis, and coherence [NBTwiki.net]](http://cdn.pearltrees.com/s/pic/th/analysis-neuronal-coherence-83541747)
Let’s quantify the frequency distribution of 'power' in the brain and noise signals using 'pwelch.m'. The 'pwelch' function is a high-level build-in MATLAB function based on the FFT. The input to the function is: A data vector. A 'window' (the data are divided into segments of the length specified by this integer, which makes the assumption of stationarity more valid). The nFFT is a valuable parameter especially for long data, because (as we learned in the tutorial on The Discrete Fourier Transformation (DFT): Definition and numerical examples) you get as many frequency components in the frequency domain as you have samples in your input data in the time domain. Amplitude and power spectra are frequently plotted in logarithmic scales.
Www.jstatsoft.org/v33/i05/paper. OpenNN. 6.4. Introduction to Time Series Analysis. Mathematische Statistik: A First Course on Time Series Analysis with SAS. "A First Course on Time Series Analysis with SAS" is an open source book project to create a mathematically oriented introduction to time series analysis.
You can download the book (in pdf-format) as well as the data sets and the SAS programming code free of charge. It is also possible to directly order a printed copy of the the book. If you are interested in making changes to the book please read the preamble. The analysis of real data by means of statistical methods with the aid of a software package common in industry and administration usually is not an integral part of mathematics studies, but it will certainly be part of a future professional work. The present book links up elements from time series analysis with a selection of statistical procedures used in general practice including the statistical software package SAS.
This book is meant for a two semester course (lecture, seminar or practical training) where the first three chapters can be dealt within the first semester. Time series - Encyclopedia of Mathematics. Time series. Time series: random data plus trend, with best-fit line and different applied filters A time series is a sequence of data points, measured typically at successive points in time spaced at uniform time intervals.
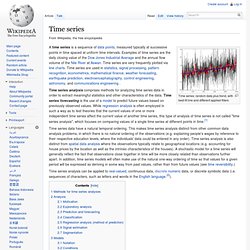
Examples of time series are the daily closing value of the Dow Jones Industrial Average and the annual flow volume of the Nile River at Aswan. Time series are very frequently plotted via line charts. Time series are used in statistics, signal processing, pattern recognition, econometrics, mathematical finance, weather forecasting, earthquake prediction, electroencephalography, control engineering, astronomy, and communications engineering . Time series data have a natural temporal ordering. Time series analysis can be applied to real-valued, continuous data, discrete numeric data, or discrete symbolic data (i.e. sequences of characters, such as letters and words in the English language.[2]). Methods for time series analyses[edit] Analysis[edit] Motivation[edit] Classification[edit]