
FAQ 978 - What is the meaning of * or ** or *** in reports of statistical significance from Prism or InStat? Prism and InStat use this convention: This is fairly standard, but not completely, so you ought to state the scale in your figure legends or methods section.
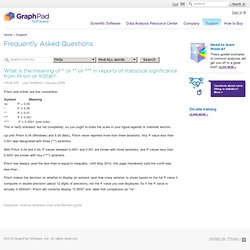
Up until Prism 5.04 (WIndows) and 5.0d (Mac), Prism never reported more than three asterisks. Any P value less than 0.001 was designated with three (***) asterisks. With Prism 5.04 and 5.0d, P values between 0.0001 and 0.001 are shown with three asterisks, and P values less than 0.0001 are shown with four (****) asterisks. Freestatistics.info. Scientific Data Analysis and Graphing Software. SigmaPlot software helps you quickly create exact graphs SigmaPlot graphing software from SYSTAT takes you beyond simple spreadsheets to help you show off your work clearly and precisely. With SigmaPlot, you can produce high-quality graphs without spending hours in front of a computer. SigmaPlot offers seamless Microsoft Office integration, so you can easily access data from Microsoft Excel spreadsheets and present your results in Microsoft PowerPoint® presentations.
Graphing software that makes data visualization easy Graph creation starts with SigmaPlot's award-winning interface. Free Statistical Software.