
5 Basic Tools for Measuring Your Content’s Social Reach. Making the life cycle of your content less of a mystery will bring you closer to writing a winning strategy.

The most popular tool, of course, is Google Analytics — a simple and fun way to track page views, plus discover neat stuff about your audience, like where your visitors are coming from, what language they speak, and even what operating system they use. But, this is just the beginning. When you share links to your content on many social networks, you want to see them spread — more exposure means more clicks back to your site. Measuring and analyzing this social reach will help you target content and resources to the right places. Check out the following five tools to see how you can better measure your content’s social reach. 1. Bitly, a URL shortener that enables users to track link performance, is a must. If you know you’ll re-post a link, you can also come back and use the same shortened link and watch how it performs over time. 2. 3. 4. 5.
Image courtesy of Flickr, Solveig Related. The Most Powerful Colors in the World by COLOURlovers. When we released our report on the colors of the social web, based on data analyzed by our Twitter theme tool, we were surprised that blue was such a dominant color in people's profile designs.
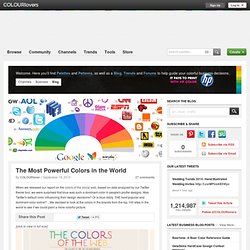
Was Twitter's default color influencing their design decisions? Or is blue really THE most popular and dominant color online? ...We decided to look at the colors in the brands from the top 100 sites in the world to see if we could paint a more colorful picture. [click to view in full size] Turns out the blue-berry doesn't fall far from the bush. While the initial reasoning for the colors chosen may be trivial, the impact that these dominant players now have in the web world will surely influence the smaller startups that want to share in the positive color associations created by their bigger siblings... Would A Corporation By Any Other Color, Still Profit As Well? Color is an important part of any brand, but along with the actual name of a company... The Colors of 1 Million Brand Icons Uh-oh! Team. 65% of online adults use social networking sites, and most describe their experiences in positive terms. 65% of online adults use social networking sites, and most describe their experiences in positive terms.

Two-thirds of adult internet users (65%) now say they use a social networking site like MySpace, Facebook or LinkedIn, up from 61% one year ago. That’s more than double the percentage that reported social networking site usage in 2008 (29%). And for the first time in Pew Internet surveys it means that half of all adults (50%) use social networking sites. The pace with which new users have flocked to social networking sites has been staggering; when we first asked about social networking sites in February of 2005, just 8% of internet users – or 5% of all adults – said they used them.
When we asked SNS users to describe their experiences using the sites, here’s what they said: New Infographic: The Brandsphere by Brian Solis and JESS3. InShare698 In discussions about new media, you will often hear the division of media opportunities as Paid, Owned, and Earned media (P.O.E.M.).
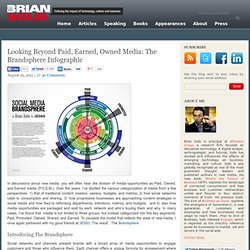
Over the years, I’ve studied the various categorization of media from a few perspectives, 1) that of traditional content creation, owners, budgets, and metrics, 2) how social networks cater to consumption and sharing, 3) how progressive businesses are approaching content strategies in social media and how they’re rethinking departments, intentions, metrics, and budgets, and 4) also how media opportunities are packaged and sold by each network and who’s buying them and why. In many cases, I’ve found that media is not limited to three groups, but instead categorized into five key segments: Paid, Promoted, Owned, Shared, and Earned. To visualize the model that reflects the state of new media, I once again partnered with my good friends at JESS3. The result…The Brandsphere. 1. 2. 3. 4: Promoted: in-stream or social paid promotions vehicles (e.g. 5.
2012 Nonprofit Communications Trends Report. Non Profit Social Media Trends. Six Ways Non-Profits Can Use Social Media to Grow.