infografiki

TwitterFacebook
Get flash to fully experience Pearltrees

Collection of 10 Distribution Plushies by NausicaaDistribution

Here is a picture of what may go down as the most awkward weeklong tour of Ireland ever. In a rare chance of fate the five distributions and five evil distributions had been both booked on the same tour group of the Emerald Isle. And it wouldn’t have been that bad, but Uniform tried to transform himself to make impersonations of the other distributions. Then Poisson would make everyone guess how long it would be until the next bout of turbulence or take to get a table, or anything. The final straw though was when Chi-Square made a Type II error and said everyone would fit in a small boat, which they didn’t -and promptly sank. http://www.etsy.com/listing/71739287/collection-of-10-distribution-plushies
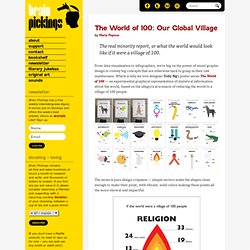
From data visualization to infographics, we’re big on the power of smart graphic design to covey big concepts that are otherwise hard to grasp in their raw numberness. Which is why we love designer Toby Ng ‘s poster series The World of 100 — an experimental graphical representation of statistical information about the world, based on the allegorical scenario of reducing the world to a village of 100 people. The series is pure design crispness — simple vectors make the shapes clean enough to make their point, with vibrant, solid colors making those points all the more visceral and impactful. In a weird way, we were the most shocked by the least consequential ones, our daily entitlements that we take for granted — somehow, PSA’s and the general sense of social responsibility have made most of us aware of severe problems like hunger , deadly disease , and the lack of clean drinking water . But computers? Not something we’d given much thought to, and yet:

The World of 100: Our Global Village | Brain Pickings

http://www.brainpickings.org/index.php/2009/03/13/the-world-of-100/

Eileen Lopez :: Graphic Designer

Video Game Timeline Since I'm an avid video game player, I wanted to create something associated with their history. The end result - a 36" x 42" poster detailing the top selling video games from 20 popular system since the 1970s. http://eileenlopez.net/videogametimeline.html

Ecstasy w animacji | Neurotyk - Psychologia, neuropsychologia, mózg

Zwłaszcza, jeśli przy tworzeniu animacji za źródło mamy artykuł publikowany w czasopiśmie naukowym. Nie sposób mieć innego wrażenia, ponieważ większość informacji tutaj przedstawionych pokrywa się z tymi omówionymi przeze mnie wcześniej, we wpisie o historii terapii MDMA . Ale sami oglądnijcie – kawał dobrej roboty. http://www.neurotyk.net/2011/01/ecstasy-w-animacji/

Size of the Universe

Because you can never get enough videos to remind you how tiny you are compared to the rest of the world . Catch the video below. And a good MLK day to you. http://flowingdata.com/2011/01/17/size-of-the-universe/
Hey, wait a minute! We noticed that you may be using an unsupported browser. All the basics will still work, but to get the most out of Flickr please upgrade to the latest version of Chrome , Safari , Firefox , or Internet Explorer .

Trânsito 3 final (2007) | Flickr - Photo Sharing!

http://www.flickr.com/photos/gersonmora/3702252913/

100 of the best data visualisations and infographics

http://visualisationmagazine.com/100datavis.htm HTML Unique Visitors Counter compiled by Chris Watson | I tried to choose by there difference in style, different creators (as density design could be featured quite a lot). All are thumbnails (click to view larger)
art i zaangazowane

jose.duarte's stuff tagged with visualization

What are tags? You can give your uploads a "tag", which is like a keyword. Tags help you find things which have something in common. You can assign up to 75 tags to each photo or video. http://www.flickr.com/photos/joseduarteq/tags/visualization/

2+3D | Najlepsze projekty dyplomowe » Przyimka Roma

Panaceum cywilizacji XXI wieku to uzupełnienie ciekawego dyplomu z zakresu całościowej identyfikacji wizualnej wydawnictwa. Jury postanowiło jednak wyróżnić właśnie aneks do dyplomu. Doceniło nie tylko społeczny wydźwięk pracy, ale przede wszystkim nieczęsto podejmowane działania projektowe z dziedziny wizualizacji danych statystycznych. http://www.projektydyplomowe.pl/edycje/20082009/przyimka-roma/