
7 Levels of SM Engagement. There are seven stages to social media engagement from shallow monitoring to deep peer to peer economies.

How deep is the rabbit hole of social media? Is your organisation doing the minimum they can do, or are they quite advanced? I put together this diagram to show the steps from shallow engagement such as just monitoring to full engagement including co-creating products and services. It’s probably worth noting that every baby steps stage in social media engagement is valid – from little acorns big ol’ oak trees grow Stage Zero - What is Social Media? Doesn’t know, doesn’t care about social media. Stage One – Internal and Enterprise approach to Social Media Social Media means “waste of time” – Facebook and Twitter are blocked at the firewall because we don’t want people wasting time on social networks, even on their lunch break.
There are plans to set up an internal blog, wiki, collaborative knowledge management system, Yammer. Stage Two: Social Media Monitoring and Eavesdropping. Blooms Taxonomy with Apps. iPad for Teaching & Learning. Cool furniture. Listen listen! Infographs. InfoGraphic Designs: Overview, Examples and Best Practices. Information graphics or infographics are visual representations of information, data or knowledge.
These graphics are used where complex information needs to be explained quickly and clearly, such as in signs, maps, journalism, technical writing, and education. They are also used extensively as tools by computer scientists, mathematicians, and statisticians to ease the process of developing and communicating conceptual information. They can present a rich amount of information without intimidating you. Or sometimes they intimidate you, but make the digesting of the information much more bearable. Here in this article below, we are going to discuss best practices for designing infographics followed by some examples which might help you learn a thing or two. You may be interested in the following related articles as well. Feel free to join us and you are always welcome to share your thoughts that our readers may find helpful.
Don’t forget to and follow us on Twitter — for recent updates. 01. 10 Awesome Tools To Make Infographics. Advertisement Who can resist a colourful, thoughtful venn diagram anyway?

In terms of blogging success, infographics are far more likely to be shared than your average blog post. This means more eyeballs on your important information, more people rallying for your cause, more backlinks and more visits to your blog. In short, a quality infographic done well could be what your blog needs right now. Designing An Infographic Some great tips for designing infographics: Keep it simple! Ideas for infographic formats include: Timelines;Flow charts;Annotated maps;Graphs;Venn diagrams;Size comparisons;Showing familiar objects or similar size or value. Here are some great tutorials on infographic creation: Creating Your Infographic Plan and research.If required, use free software to create simple graphs and visualisations of data.Use vector graphic software to bring these visualisations into the one graphic. Free Online Tools For Creating Infographics Stat Planet Hohli Creately New York Times. Diagramly – A Handy Tool For Creating Quick Flowcharts.
The best thing about Diagramly is how accessible it is.

You just click a URL, and you’re in. There’s no download, no account registration, and you don’t even need Flash to use it. It really couldn’t be simpler to get started. The worst thing about Diagramly (I’ll just get this out of the way right now) is the utter lack of documentation. For example, check out this diagram I made for you, showing the ideal MakeUseOf reader’s workflow: Pretty easy to understand, right? Let’s take a look at the UI: I included Chrome’s address bar on purpose, so you’d see it really is a Web app. Here are just a few samples I picked at random: Why there is a Shield of David there, I have absolutely no idea.
Once you’re done crafting your masterpiece, you can save it in one of a number of formats: Saving as an SVG is very handy if you have a desktop vector editing application (such as the free and open-source Inkscape). Why America's Healthcare Sucks. You know it is true.
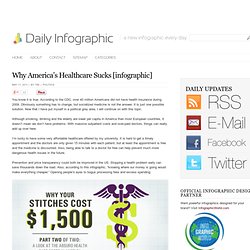
According to the CDC, over 40 million Americans did not have health insurance during 2009. Obviously something has to change, but socialized medicine is not the answer. It is just one possible solution. Now that I have put myself in a political grey area, I will continue on with this topic. Although smoking, drinking and the elderly are lower per capita in America than most European countries, it doesn’t mean we don’t have problems.
I’m lucky to have some very affordable healthcare offered by my university. Prevention and price transparency could both be improved in the US. TED Cloud.