
第一次玩 D3.js 就上手. Flare. PuppyDev. Hello again dear readers!
Last time we took a look at D3.js and talked about its basics for a while. Today we're going to look at the two most basic hierarchy layouts in D3.js: the tree and the cluster. These two layouts are very similar. The only difference between them is that the cluster layout generates a dendrogram, which puts all the leaf nodes on the same level. The tree is more concerned about the levels themselves. So, how do I work with layouts? But less talking, more coding, right? For all the code we'll use similar HTML: 1<html> 2 <head> 3 <script src=" charset="utf-8"></script> 4 </head> 5 <body> 6 <svg> 7 </svg> 8 </body> 9</html> Just insert another <script> tag with the needed JavaScript right before the closing </body> tag. Tree We'll start with the tree layout. So, what do we do here?
The really interesting part starts here: 【 D3.js 选择集与数据详解 — 2 】 使用data()绑定数据,d3.jsdata_WEB前端教程. D3 中绑定数据大多是由 data() 函数来完成的,它是怎样工作的,它与 datum() 有什么区别呢?

Data()函数能够将数组各项分别绑定到各元素上,而且能够设置绑定的规则。 Data()还能够处理数组长度与元素数量不一致的情况。 当数组长度大于元素数量,能为多余数据预留元素位置,以便将来插入新元素;当数组长度小于元素数量时,能提供指向多余元素的方法,以便将来删除。 下面来剖析data()是如何绑定数据的,相比datum()有哪些新功能。 假设body中有三个段落元素p,HTML代码如下: OUR D3.JS. 矩阵树图(Treemap),也是层级布局的扩展,根据数据将区域划分为矩形的集合。

D3.js: How to handle dynamic JSON Data. When I started with d3.js, I really struggled understanding how I could link data from a JSON feed to a SVG graph.
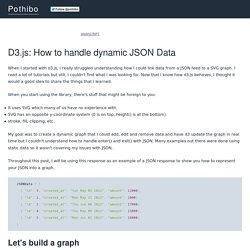
I read a lot of tutorials but still, I couldn't find what I was looking for. Now that I know how d3.js behaves, I thought it would a good idea to share the things that I learned. When you start using the library, there's stuff that might be foreign to you: It uses SVG which many of us have no experience with. SVG has an opposite y-coordinate system (0 is on top, height() is at the bottom). stroke, fill, clipping, etc. My goal was to create a dynamic graph that I could add, edit and remove data and have d3 update the graph in real time but I couldn't understand how to handle enter() and exit() with JSON.
Throughout this post, I will be using this response as an example of a JSON response to show you how to represent your JSON into a graph. Let's build a graph Before anything else, a working graph would be the best way to get started. Hint: You can click on the dots. Scales Range. 資料視覺化. [Modern WebConf 2015] D3 圖表優化二三事. Marmelab/EventDrops. Edit fiddle. Basic Directional Force Layout Diagram. Mobile Patent Suits. D3 Tutorial Table of Contents. Andrew's Chord Example. Uber Rides by Neighborhood. Source: Uber Blog.
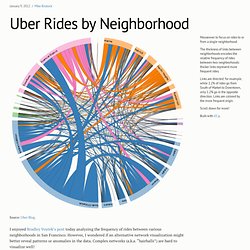
I enjoyed Bradley Voytek’s post today analyzing the frequency of rides between various neighborhoods in San Francisco. However, I wondered if an alternative network visualization might better reveal patterns or anomalies in the data. Complex networks (a.k.a. “hairballs”) are hard to visualize well! This dataset is particularly interesting because it has directed edges.
Some alternatives I considered: A matrix diagram visualizes the adjacency matrix of the network by showing a two-dimensional grid; each cell in the grid encodes the relative frequency of rides from neighborhood i to neighborhood j. A chord diagram arranges the nodes (neighborhoods) radially, drawing thick curves between nodes. If I had more time, I might also take a look at hive plots, which are a bit like radial parallel coordinates. DependencyWheel: An Interactive Visualization Of Package Dependencies. Modern development use package managers (composer, npm, bundler, etc.).
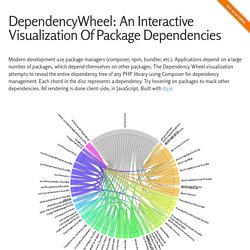
Applications depend on a large number of packages, which depend themselves on other packages. The Dependency Wheel visualization attempts to reveal the entire dependency tree of any PHP library using Composer for dependency management. Each chord in the disc represents a dependency. Try hovering on packages to mask other dependencies. All rendering is done client-side, in JavaScript. Do you want to try it out with another project? Purpose Did you ever dive into an existing project and wonder how much code is hidden behind a given dependency? DependencyWheel tries to answer these needs.
Usage. Word Cloud Generator. Trend Chart (Area + Line) Force-layout of Cable2Graph. API Reference · mbostock/d3 Wiki.