
עלון מקוון. מאת: ענבל נגבי ואפרת מעטוף עלון מקוון יכול לשמש למגוון מטרות בתחום החינוך: מנהלי בתי ספר יכולים ליצור עלון מקוון לשם הפצת עדכונים שוטפים לרשויות, להורים וללומדים.
ניתן להפיץ את העלון על בסיס שבועי או חודשי ולציין בו מידע אודות פעילויות ופרויקטים ייחודיים אותם מוביל המוסד. רכזי מקצוע ומורים משתמשים בעלונים מקוונים להפצת מידע על מיזמים בתחום הדעת הרלוונטי: חידונים, תחרויות, סיורים וכו'. כיצד צבע יכול לקדם למידה? פתרונות מעשיים- מקרו ומיקרו. Awesome New Themes to Create Professional Infographics and Website Banners. Awesome New Templates to Create Professional Infographics and Website Banners The Visme user base continues to gain traction; we have thousands of projects created weekly by users from all walks of life.
Awesome New Themes to Create Professional Infographics and Website Banners. Professional Websites made with Easy WebContent - Best online website builder. Easy WebContent customers make great websites.
We give you the tools and workflow to make a site your own. Take a look at some of the sites our customers have created. Shannon Cakes Type: Business Antonia Felix | Famous Author Type: Business / Blog. Sprites. 10 free tools for creating infographics. Done right, infographics can be a great way to make sense of complex data.
The best infographics transform complex information and data into graphics that are both easy to grasp and visually appealing. The only problem is, infographics that look like they were simple to make are often anything but. Exclusive offer: Save 15% on Adobe Creative Cloud now Here, we've selected our top free tools and apps for making infographics. Some of the options here are even suitable for non-designers, as templates and other features make them easy to use. Give these free tools a try and let us know which ones you get on best with on Facebook or Twitter. 01. זרימה - Flow. להורדת המאמר האם אי פעם הרגשתם שאתם שקועים ומרוכזים כל כולכם בפעילות כלשהי, עד כדי כך שלא חשבתם על שום דבר מלבד מה שאתם עושים באותו הרגע?
האם הרגשתם בעת הפעילות שהזמן 'טס', שאתם נהנים ומתלהבים, שאתם בשליטה מלאה, שהיכולות הכי טובות שלכם באות לידי ביטוי וביכולתכם להתמודד עם כל אתגר שיצוץ? אם אי פעם חוויתם מצב שכזה - חוויתם 'זרימה'. במילון אבן שושן מציין המונח 'זרימה' תנועה רציפה, שטף בלתי פוסק של נוזלים. במחקר הפסיכולוגי נעשה שימוש מטאפורי במונח זה כדי לתאר תופעה של חווית שיא סובייקטיבית, שאותה תיאר וחקר לראשונה הפסיכולוג מיהַי צִ'יקסֶנְטְמְהַיִי (Csikszentmihalyi, 2000, 1990). הנה שתי דוגמאות (בתרגום חופשי, ו.ר.) Infographics Gallery. Create and share visual ideas online. Visio Alternative that’s Simpler, Powerful & Affordable. How It Works. Visul.ly. Tagxedo - Word Cloud with Styles. Infogr.am. Great Infographic Making Tools for Teachers. 1- Visual.ly This is my favorite tool.

It helps you easily create awesome infographics using pre-designed templates. It also lets you create an infographic out of any Twitter Hashtag provided you are signed in which you can do using your Twitter account. Data Visualization, Infographics, and Statistics. 10 Useful Flash Components for Graphing Data. By Jacob Gube Flash is an excellent technology for dealing with data visualization.

It being client-side, it can reduce the amount of work your server has to perform in order to generate graphs and charts. Because of its robust ability in dealing with sleek and fluid animation and complex user interactivity, Flash is an excellent web and (and even desktop) application technology for dealing with graphing data. In this article, you will find ten excellent Flash components that will help you in building stunningly attractive, complex, and interactive data visuals. These components will help you create an assortment of graphs and charts to aid in presenting otherwise boring and stale numerical data. 1.
Tools - Cool Infographics. Adioma creates information graphics out of your textual data, using timelines, grids and icons.
Create impressive charts from spreadsheets. Assemble into dashboards, embed in websites, or simply share a link. A Python interactive visualization library that targets modern web browsers for presentation Cacoo is a free online drawing tool that allows you to create a variety of diagrams such as site map, flowchart, mind map, wire frame, UML diagram and network diagram. Crowdsourced Analytics Solution Marketplace - Make Sense of Big Data Free interactive charts created online in seconds ChartGo is an online graph maker tool.
Simply choose your settings, enter your data and hit create. Great Infographic Making Tools for Teachers. VIS. Visual Investigative Scenarios platform: Pages. WordSift - Visualize Text. Make Your Images Interactive - ThingLink. How to create an infographic in 5 minutes. This page teaches you how to create a Piktochart infographic in 5 minutes (6 steps).
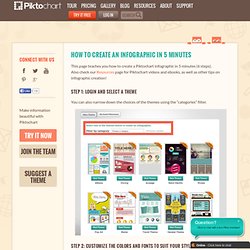
Also check our Resources page for Piktochart videos and ebooks, as well as other tips on infographic creation! Step 1: Login and select a theme. כלי עזר ליצירת אינפוגראפיקה בחינוך ובהדרכה. The Marketer's Simple Guide to Creating Infographics in PowerPoint [+Templates] שיווק.net: 10 כלים לעיצוב אינפוגרפיות מהממות. הטרנד הוויראלי ביותר כרגע, הוא כנראה האינפוגרפיות.
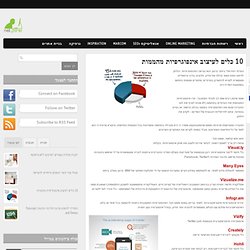
יכולתן לדחוס כמות מאוד גדולה של מידע, ולהציגו בדרך וויזואלית, מאפשרת לקורא להתעדכן בטרנדים, מחקרים ומגמות בתחום באמצעות המדיה הזו. אנשי שיווק רבים שמו לב לטרנד המתגבר, יצרו אינפוגרפיות המסכמות את הטרנדים בתחומם (לא שכחו לצרף את לוגו החברה) עטפו את האינפוגרפיה בפוסט בבלוג הרשמי, או בציוץ בטוויטר, ונתנו לוויראליות הטבעית של המדיום - לקדם את התוכן. החברה המפרסמת מרוויחה משום שהסאבטקסט משדר כי היא מובילה בתחומה ומעודכנת בכל המגמות החדשות, והקורא מרוויח כי הוא לומד על כל החדשות האחרונות, מבלי באמת לקרוא את המחקרים הארוכים. win win קלאסי, פשוט וקל. עכשיו רק צריך לאסוף דאטה, לבחור שירות ולעצב את אותן אינפוגרפיות. Visual.ly כלי חינמי לייצור אינפוגרפיות. Many Eyes. Infographics & Data Visualization. Venngage - Think with your eyes. Data Insights. Made Social.
Create Infographics. Create and share visual ideas online. Piktochart - Infographic Maker. Tools - Cool Infographics. Create and share visual ideas online. כלי עזר ליצירת אינפוגראפיקה בחינוך ובהדרכה. Netcraft Bytes :) » 8 כלים ליצירת אינפוגרפיקה. אני אוהב אינפוגרפיקה טובה, הצגת מידע באופן ברור ורלוונטי הופכת את תהליך ההבנה לפשוט ומהנה. יישום נכון של אינפוגרפיקה הוא כלי עוצמתי שמאפשר למשתמש להעמיק בנושאים חדשים בצורה קלה יותר. מצד שני אינפוגרפיקה יכולה גם להיות מבלבלת ומטעה כאשר אינה מבוצעת היטב. כמאפיין חווית משתמש אני מודע לשעות הרבות והמיומנות הנדרשת על מנת לעצב מידע באופן ויזואלי, ברור ורלוונטי - מידע שמוצג באופן שימושי ויעיל, שמפשט את המורכבויות, שנראה מרשים ואפילו מסב הנאה עבור האנשים שמשתמשים במוצר.
מאחר שמדובר במדע שלם שדורש מחקר ונסיון רב, אספתי עבורכם מספר כלים שמיועדים לקצר את הדרך ולייצר אינפוגרפיקה מרשימה בזמן קצר. Piktochart: Infographic and Graphic Design for Non-Designers. Dipity - Find, Create, and Embed Interactive Timelines. Many Eyes.