
Visual modeling. Visual modeling is the graphic representation of objects and systems of interest using graphical languages.
Visual modeling languages may be General-Purpose Modeling (GPM) languages (e.g., UML, Southbeach Notation, IDEF) or Domain-Specific Modeling (DSM) languages (e.g., SysML). They include industry open standards (e.g., UML, SysML), as well as proprietary standards, such as the visual languages associated with VisSim, MATLAB and Simulink, OPNET, and NI Multisim. Rgraphviz. Graphviz. Teacher package: Mathematical Modelling. September 2007 This is the second installment of a new feature in Plus: the teacher package.

Every issue contains a package bringing together all Plus articles about a particular subject from the UK National Curriculum. Whether you're a student studying the subject, or a teacher teaching it, all relevant Plus articles are available to you at a glance. What do you think? This is the second package in a new series for Plus, and we'd be very pleased to hear what our readers think. Thank you! Plus articles go far beyond the explicit maths taught at school, while still being accessible to someone doing A level maths. Mathematical modelling Mathematics is often called "the language of the universe".
The Plus articles listed below all deal with mathematical modelling. Models in Science. 1.

Semantics: Models and Representation. Mathematical model. Control Systems/Signal Flow Diagrams - Wikibooks, collection of open-content textbooks. Signal Flow Diagrams[edit] Signal Flow Diagrams are another method for visually representing a system.
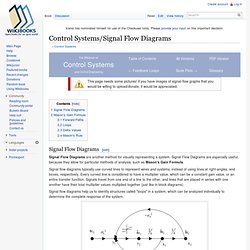
Signal Flow Diagrams are especially useful, because they allow for particular methods of analysis, such as Mason's Gain Formula. Signal flow diagrams typically use curved lines to represent wires and systems, instead of using lines at right-angles, and boxes, respectively. Every curved line is considered to have a multiplier value, which can be a constant gain value, or an entire transfer function.
Signals travel from one end of a line to the other, and lines that are placed in series with one another have their total multiplier values multiplied together (just like in block diagrams). Control theory. The concept of the feedback loop to control the dynamic behavior of the system: this is negative feedback, because the sensed value is subtracted from the desired value to create the error signal, which is amplified by the controller.
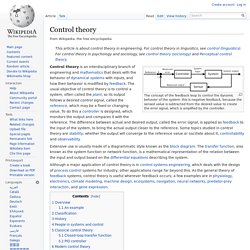
Extensive use is usually made of a diagrammatic style known as the block diagram. The transfer function, also known as the system function or network function, is a mathematical representation of the relation between the input and output based on the differential equations describing the system. Although a major application of control theory is in control systems engineering, which deals with the design of process control systems for industry, other applications range far beyond this. As the general theory of feedback systems, control theory is useful wherever feedback occurs; a few examples are in physiology, electronics, climate modeling, machine design, ecosystems, navigation, neural networks, predator-prey interaction, and gene expression. Overview[edit] Graphical Models. By Kevin Murphy, 1998.
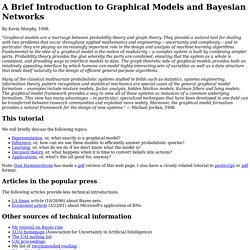
"Graphical models are a marriage between probability theory and graph theory. They provide a natural tool for dealing with two problems that occur throughout applied mathematics and engineering -- uncertainty and complexity -- and in particular they are playing an increasingly important role in the design and analysis of machine learning algorithms. Fundamental to the idea of a graphical model is the notion of modularity -- a complex system is built by combining simpler parts. Probability theory provides the glue whereby the parts are combined, ensuring that the system as a whole is consistent, and providing ways to interface models to data. The graph theoretic side of graphical models provides both an intuitively appealing interface by which humans can model highly-interacting sets of variables as well as a data structure that lends itself naturally to the design of efficient general-purpose algorithms. gRaphical models in R. Graph algebra (social sciences) Signal-flow graph.
A signal-flow graph (SFG) is a special type of block diagram[1]—and directed graph—consisting of nodes and branches.
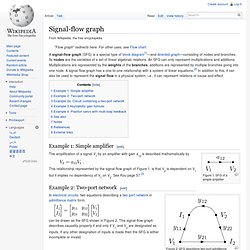
Its nodes are the variables of a set of linear algebraic relations. An SFG can only represent multiplications and additions. Multiplications are represented by the weights of the branches; additions are represented by multiple branches going into one node. Courtney Brown, Ph.D. Selected Bibliography for Modeling Social Phenomena Abraham, Ralph H. and Christopher D.
Shaw. 1992. Dynamics: The Geometry of Behavior, Second Edition. Redwood City, California: Addison-Wesley. Graph Algebra and Social Theory : SAGE Research Methods Online. Graph Algebra: Mathematical Modeling with a Systems Approach. From the publisher's description of the book: Graph Algebra: Mathematical Modeling with a Systems Approach introduces a new modeling tool to students and researchers in the social sciences.

Derived from engineering literature that uses similar techniques to map electronic circuits and physical systems, graph algebra utilizes a systems approach to modeling that offers social scientists a variety of tools that are both sophisticated and easily applied. Key Features: Designed for readers in the social sciences with minimal mathematical training: In this volume, the author assists readers in developing their own difference and differential equation model specifications.
Incorporates Social Theory: This book describes an easily applied language of mathematical modeling that uses boxes and arrows to develop very sophisticated algebraic statements of social and political phenomena. 15595_Chapter_1.pdf (objeto application/pdf) Systems Analysis for Social Scientists (Comparative studies in behavioral science) (9780471175094): Fernando Cortes, Adam Przeworski, John Sprague. Dynamic Modeling 1: Linear Difference Equations. (This is the first in a series on the use of Graph Algebraic models for Social Science.)
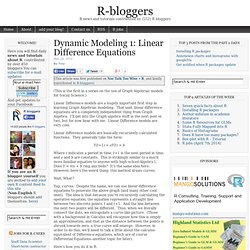
Linear Difference models are a hugely important first step in learning Graph Algebraic modeling. That said, linear difference equations are a completely independent thing from Graph Algebra. I’ll get into the Graph algebra stuff in the next post or two, but for now bear with me. Linear Difference models are very cool. Linear difference models are basically recursively-calculated functions. Dynamic Modeling 2: Our First Substantive Model. (This is the second of a series of ongoing posts on using Graph Algebra in the Social Sciences.) First-order linear difference equations are powerful, yet simple modeling tools. They can provide access to useful substantive insights to real-world phenomena. They can have powerful predictive ability when used appropriately. Additionally, they may be classified in any number of ways in accordance with the parameters by which they are defined. And though they are not immune to any of a host of issues, a thoughtful approach to their application can always yield meaningful information, if not for discussion then for further refinement of the model.
Let’s look at that example from the last post: OK, time to reveal the secret. Dynamic Modeling 3: When the first-order difference model doesn’t cut it. Data must be selected carefully. The predictive usefulness of the model is grossly diminished if outliers taint the available data. Figure 1, for instance, shows the Defense spending (as a fraction of the national budget) between 1948 and 1968. Courtney Brown, Ph.D. Help! My model fits too well! This is sort-of related to my sidelined study of graph algebra. I was thinking about data I could apply a first-order linear difference model to, and the stock market came to mind. After all, despite some black swan sized shocks, what better predicts a day’s closing than the previous day’s closing? So, I hunted down the data and graphed exactly that: