
Statistical foundations of machine learning. Fundamentals of Epidemiology II : Lecture Materials. OCW offers a snapshot of the educational content offered by JHSPH.

OCW materials are not for credit towards any degrees or certificates offered by the Johns Hopkins Bloomberg School of Public Health. For information on for-credit courses go to: . Unlike for-credit courses, OpenCourseWare does not require registration and does not provide access to the School's faculty. Module Number 5: Epidemiologic Study Designs Distinguish between experimental and observational studies Identify the design elements of a clinical trial Discuss the issues in the design and conduct of a clinical trial Describe the design elements of cohort studies Distinguish between a concurrent and a retrospective cohort study Discuss the issues in the design and conduct of a cohort study Discuss the biases that may affect cohort studies Recognize a cohort study desgin when reading epidemiologic literature Describe the concept of healthy worker effect.
4297 MODULE 17. Psych. Statistics: One way analysis of variance (ANOVA), Analysis of Variance - One Way Practice Problems (Answers) Homework I.

Introduction The ANalysis Of VAriance (or ANOVA) is a powerful and common statistical procedure in the social sciences. It can handle a variety of situations. The example that follows is based on a study by Darley and Latané (1969). How do we analyze this data? The amount of computational labor increases rapidly with the number of groups in the study.
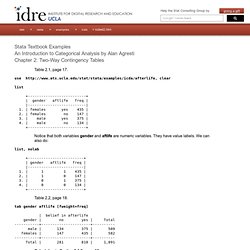
II. The reason this analysis is called ANOVA rather than multi-group means analysis (or something like that) is because it compares group means by analyzing comparisons of variance estimates. We draw three samples. Group Membership (i.e., the treatment effect or IV). The ANOVA is based on the fact that two independent estimates of the population variance can be obtained from the sample data. Given the null hypothesis (in this case HO: m1=m2=m3), the two variance estimates should be equal. III. We already knew that: i = any score n = the last score (or the number of scores) Stata: An Introduction to Categorical Analysis by Alan Agresti, Chapter 2. Stata Textbook Examples An Introduction to Categorical Analysis by Alan Agresti Chapter 2: Two-Way Contingency Tables Table 2.1, page 17. use clear list +--------------------------+ | gender aftlife freq | |--------------------------| 1. | females yes 435 | 2. | females no 147 | 3. | male yes 375 | 4. | male no 134 | +--------------------------+ Notice that both variables gender and aftlife are numeric variables.

They have value labels. We can also do: list, nolab +-------------------------+ | gender aftlife freq | |-------------------------| 1. | 1 1 435 | 2. | 1 0 147 | 3. | 0 1 375 | 4. | 0 0 134 | +-------------------------+ Table 2.2, page 18. tab gender aftlife [fweight=freq] | belief in afterlife gender | no yes | Total -----------+----------------------+---------- male | 134 375 | 509 females | 147 435 | 582 -----------+----------------------+---------- Total | 281 810 | 1,091 Calculation in Section 2.1.2, page 18.
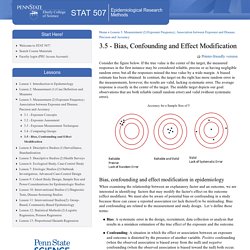
Calculation on difference of proportions in Section 2.2.1, page 20. Tobias. 3.5 - Bias, Confounding and Effect Modification. Consider the figure below.

If the true value is the center of the target, the measured responses in the first instance may be considered reliable, precise or as having negligible random error, but all the responses missed the true value by a wide margin. A biased estimate has been obtained. In contrast, the target on the right has more random error in the measurements, however, the results are valid, lacking systematic error. The average response is exactly in the center of the target. The middle target depicts our goal: observations that are both reliable (small random error) and valid (without systematic error).
Accuracy for a Sample Size of 5.