
FORM+CODE In Design, Art, and Architecture by Casey Reas, Chandler McWilliams, and LUST. Visualize: SUPERFORMULA The superformula was first described by Johan Gielis in 2003 as a way to mathematically generate a wide variety of forms found in nature.
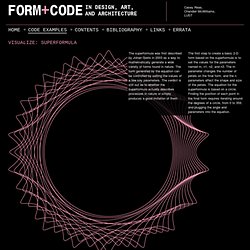
The form generated by the equation can be controlled by setting the values of a few key parameters. The verdict is still out as to whether the superformula actually describes processes in nature or simply produces a good imitation of them. The first step to create a basic 2-D form based on the superformula is to set the values for the parameters named m, n1, n2, and n3. The m parameter changes the number of petals on the final form, and the n parameters affect the shape and size of the petals. Contributed Examples We are looking for implementations of the code examples in other programming languages to post on the site. Matrix: Simulating the world Part I - Particle models.
March 2007 Building models forms the core of many areas of scientific and engineering research.
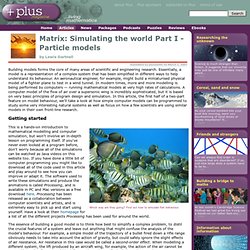
Essentially, a model is a representation of a complex system that has been simplified in different ways to help understand its behaviour. An aeronautical engineer, for example, might build a miniaturised physical model of a fighter plane to test in a wind tunnel. In modern times, more and more modelling is being performed by computers — running mathematical models at very high rates of calculations. A computer model of the flow of air over a supersonic wing is incredibly sophisticated, but it is based on very basic principles of program design and simulation. Getting started Which way are they going? This is a hands-on introduction to mathematical modelling and computer simulation, but won't involve an in-depth lesson on programming itself. Gas molecules in a box For our first model we'll write a very basic physics simulation of molecules of gas trapped in a box. Bird flocking Bats and eagles. Visual Complexity: Mapping Patterns of Information.
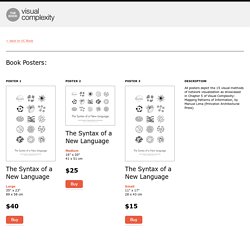
The Syntax of a New Language Large 35" x 23" 89 x 58 cm Medium 16" x 20" 41 x 51 cm Small 11" x 17" 28 x 43 cm All posters depict the 15 visual methods of network visualization as showcased in Chapter 5 of Visual Complexity: Mapping Patterns of Information, by Manuel Lima (Princeton Architectural Press)
Codes - GENERATIVE GESTALTUNG. BibleViz. This set of visualizations started as a collaboration between Christoph Römhild and myself.
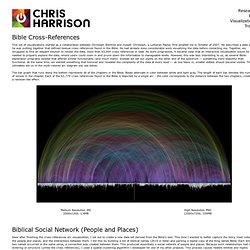
Christoph, a Lutheran Pastor, first emailed me in October of 2007. He described a data set he was putting together that defined textual cross references found in the Bible. He had already done considerable work visualizing the data before contacting me. Together, we struggled to find an elegant solution to render the data, more than 63,000 cross references in total. As work progressed, it became clear that an interactive visualization would be needed to properly explore the data, where users could zoom in and prune down the information to manageable levels. The bar graph that runs along the bottom represents all of the chapters in the Bible. Soon after finishing the cross-references arc visualization, I set out to create a new data set derived from the Bible’s text. Additional details: Entities with less than 40 connections are drawn at an angle. Tutorials: Libraries. Contributed Libraries This tutorial is an updated version of Section 12.3: Contributed Libraries.
Processing now allows for a “libraries” folder inside your Processing sketchbook, which is a great deal more convenient than having your 3rd party libraries installed in the Processing application folder. Now, when you upgrade to a new version of Processing you don’t have to copy your libraries over. As of the writing of this book, there are 47 contributed libraries, with capabilities ranging from sound generation and analysis, to packet sniffing, to physics simulations, to GUI controls. Several of these contributed libraries are demonstrated in this book’s examples. Where to install them First, locate where your Processing sketchbook. /Users/Username/Documents/Processing. Download. THE iGeo SOFTWARE IS PROVIDED TO YOU "AS IS," AND WE MAKE NO EXPRESS OR IMPLIED WARRANTIES WHATSOEVER WITH RESPECT TO ITS FUNCTIONALITY, OPERABILITY, OR USE, INCLUDING, WITHOUT LIMITATION, ANY IMPLIED WARRANTIES OF MERCHANTABILITY, FITNESS FOR A PARTICULAR PURPOSE, OR INFRINGEMENT.
WE EXPRESSLY DISCLAIM ANY LIABILITY WHATSOEVER FOR ANY DIRECT, INDIRECT, CONSEQUENTIAL, INCIDENTAL OR SPECIAL DAMAGES, INCLUDING, WITHOUT LIMITATION, LOST REVENUES, LOST PROFITS, LOSSES RESULTING FROM BUSINESS INTERRUPTION OR LOSS OF DATA, REGARDLESS OF THE FORM OF ACTION OR LEGAL THEORY UNDER WHICH THE LIABILITY MAY BE ASSERTED, EVEN IF ADVISED OF THE POSSIBILITY OR LIKELIHOOD OF SUCH DAMAGES. By downloading the software from this page, you agree to the specified terms. Beta Version 0.9.1.0 (release 2014-06-23)--> Beta Version 0.9.1.3 (release 2014-09-21) - Note for update v0.9.0.1.