
Data Visualization Software. Tableau Desktop. Many Eyes. Infographics - - Part 10. A visual exploration on mapping complex networks. GOOD Magazine Visualizations. The Anatomy Of An Infographic: 5 Steps To Create A Powerful Visual. Information is very powerful but for the most bit it is bland and unimaginative.

Infographics channel information in a visually pleasing, instantly understandable manner, making it not only powerful, but extremely beautiful. Once used predominantly to make maps more approachable, scientific charts less daunting and as key learning tools for children, inforgraphics have now permeated all aspects of the modern world. I designed a couple of infographics back in college, the need arising especially around the time Soccer World Cup fever spiked.
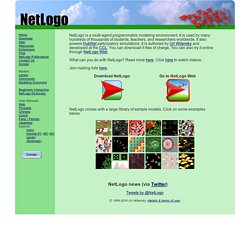
It was a fun process representing the different groups, predicting winners in each group at each stage and creating a mock pairing of teams that would clash all the way leading upto the finals. I was a devout Argentinian supporter at the time. Ideas, issues, knowledge, data - visu. NetLogo Home Page. NetLogo is a multi-agent programmable modeling environment.

It is used by tens of thousands of students, teachers and researchers worldwide. It also powers HubNet participatory simulations. It is authored by Uri Wilensky and developed at the CCL. You can download it free of charge. Mind Maps/Thinking Maps/Graphic Organizers.