
Integrative Genomics Viewer. IGV can display genome-wide association study (GWAS) data as a "manhattan plot", color-coded by chromosome.
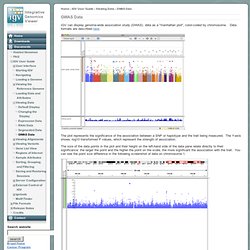
Data formats are described here. The plot represents the significance of the association between a SNP or haplotype and the trait being measured. The Y-axis shows -log10 transformed P values, which represent the strength of association. Man page of COMPUTE. Content-type: text/html Section: User Commands (1)Updated: April 3, 2002IndexReturn to Main Contents compute - a program to summarize a lot of molecular population genetic data at once. compute -i <infile> [options] compute calculates a whole slew of numbers that molecular population genetics types might be interested in.
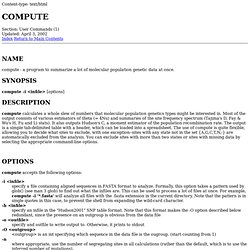
Most of the output consists of various estimators of theta (= 4Nu) and summaries of the site frequency spectrum (Tajima's D, Fay & Wu's H, Fu and Li stats). It also outputs Hudson's C, a moment estimator of the population recombination rate. Compute accepts the following options: -i <infile> specify a file containing aligned sequences in FASTA format to analyze. -h <infile> specify an infile in the "Hudson2001" SNP table format. -o <outfile> specify and outfile to write output to. PRGmatic - Sarah M. Hird. Stuff to Read - Mac vs. UNIX line breaks. If you're having trouble getting something to work right, and that something is based on a text file (for example, a Perl CGI script or a page of HTML), make sure you don't have any hidden Mac line breaks (also called line endings) in the file!
If you installed or modified the file using a GUI-based tool, there's a chance you accidentally inserted Mac line breaks. I know (from personal experience!) That Mac line breaks can make both Perl scripts and static HTML pages non-functional if they show up in the wrong spot. Read the rest to see how to find and remove the line breaks... How can you tell? If you see a bunch of ^M's in the file, you have Mac line breaks. This problem can be very difficult to diagnose, especially if you normally edit in Emacs, and try just cat'ing the file at the command line. PLINK: Whole genome data analysis toolset. Plotting Genome-Wide Association Results.
The interpretation of genome-wide association results can be greatly facilitated by visualization.
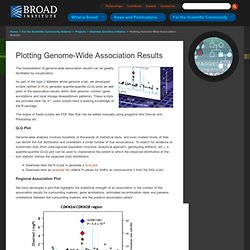
As part of the type 2 diabetes whole-genome scan, we developed scripts (written in R) to generate quantile-quantile (Q-Q) plots as well plots of the association results within their genomic context (gene annotations and local linkage disequilibrium patterns). These scripts are provided here "as is"; users should have a working knowledge of the R package. The output of these scripts are PDF files that can be edited manually using programs like Canvas and Photoshop etc. Q-Q Plot Genome-wide analysis involves hundreds of thousands of statistical tests, and even modest levels of bias can distort the null distribution and overwhelm a small number of true associations. Download here the R script to generate a Q-Q plot Download here an example file (46604 P-values for SNPs on chromosome 3 from the DGI scan) Regional Association Plot The R script needs to be modified as follows: .
Questions? Reference. How to read a genome-wide association study. As any avid follower of genomics or medical genetics knows, genome-wide association studies (GWAS) have been the dominant tool used by complex disease genetics researchers in the last five years.
There’s a very active debate in the field about whether GWAS have revolutionized our understanding of disease genetics or whether they were a waste of money for little tangible gain. No matter where you fall in that spectrum, however, you need only to browse the table of contents of any recent issue of Nature Genetics to see how ubiquitous they are. Since GWAS provide so much of the fodder for unzipping your genome, and in order to help you cut through the hype in the mainstream press coverage of GWAS, I’ve put together a quick primer on how to go straight to the original paper and decide for yourself whether it’s a landmark finding or a dud. It’s not always that easy, though! Sample size. Replication.