
ΤΖΑΡΕΤ ΤΖΕΦΡΥ - ΜΕΘΟΔΟΙ ΠΡΟΒΛΕΨΕΩΝ - 0 - plus4u. Analytics. Week 1: What is Data Science? « Introduction to Data Science, Columbia University. Cathy O’Neil will be blogging about the class after each lecture.
Crossposted from mathbabe.org I’m attending Rachel Schutt’s Columbia University Data Science course on Wednesdays this semester and I’m planning to blog the class. Here’s what happened yesterday at the first meeting. Syllabus Rachel started by going through the syllabus. Here were her main points: The prerequisites for this class are: linear algebra, basic statistics, and some programming.The goals of this class are: to learn what data scientists do. and to learn to do some of those things.Rachel will teach for a couple weeks, then we will have guest lectures.The profiles of those speakers vary considerably, as do their backgrounds. The current landscape of data science So, what is data science? NYC and Columbia to Create Institute for Data Sciences & Engineering. Mayor Michael R.
Bloomberg and Columbia University President Lee C. Bollinger today announced an agreement between the City of New York and Columbia University that will lead to the creation of a new Institute for Data Sciences and Engineering, to be located at Columbia’s Morningside Heights and Washington Heights campuses in New York City, and the hiring of dozens of new faculty within the university’s Fu Foundation School of Engineering and Applied Sciences. The announcement is the next milestone in the City’s groundbreaking Applied Sciences NYC initiative, which seeks to dramatically increase New York City’s capacity for applied sciences and engineering while strengthening and transforming the City’s economy for generations. “This historic partnership is newest element in the applied sciences initiative that is, by far, the largest and most far-reaching economic development effort City government has undertaken in modern memory,” said Mayor Bloomberg.
Weekly Wednesday Lectures « Introduction to Data Science, Columbia University. Week 14: Student Presentations, Synthesis of Semester Each week Cathy O’Neil blogs about the class.
Cross-posted from mathbabe.org. Thank you Cathy for doing such a wonderful job this semester capturing the course in this way, and also for being a respected voice in the classroom, a question-asker and role model for the students. Here’s our class photo, and Cathy’s blog post follows. Cathy’s post captures the presentation done by a subset of students, which represented a collaboration of many/most students in this course, as part of their work for a think piece. In the final week of Rachel Schutt’s Columbia Data Science course, we heard from two groups of students as well as from Rachel herself. [...] Week 13: MapReduce Each week Cathy O’Neil blogs about the class. Week 12: Predictive modeling, Data Leakage, Model Evaluation. Rachel Schutt « Introduction to Data Science, Columbia University. Doing Data Science & Ada Lovelace Day My book (with Cathy O’Neil), Doing Data Science, is now available on ebook and the print version will be available next week!
The book is based on last year’s Introduction to Data Science class. In honor of Ada Lovelace Day, O’Reilly (our publisher) is offering 50% off books by women, and so because we’re women, […] Optimization & A/B Testing Statistics by Jared Waxman. Whether you've got a lean startup or a fat Fortune 500, the faster you learn the faster you'll grow.
Optimization and a/b testing is at the heart of learning fast. I guarantee you will learn something in this course that will raise your skill level. With the 30-day money-back guarantee, you can't lose. We start with the basics, then cover the 8 steps of running a solid a/b test. Next we dive deep into the statistics behind hypothesis testing. There is double and triple digit ROI around optimization for companies that figure it out. Topics include: Examples of a/b tests Hypothesis testing Measurement as risk reduction Selecting a KPI or success metric 8 Steps for Running an A/B Test Selecting from amongs a/b test and MVT test designs Lift Threshold Null Hypothesis Statistical significance Sample size estimates confidence interval test statistic t-tests.
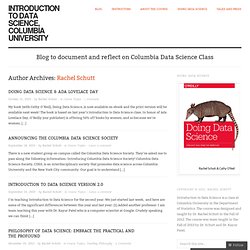
R Data Import/Export. R Statistical: Importing CSV or Excel Files. R project tutorial: reading Excel spreadsheets. Untitled. If you are running an A/B test there is an inherent trade-off between how long you run the test and how precise your answer will be.
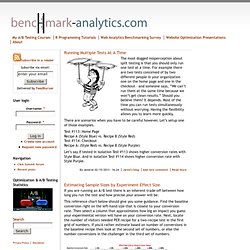
This reference chart below should give you some guidance. Find the baseline conversion right on the left-hand size that is closest to your conversion rate. Then select a column that approximates how big an impact you guess your experimental version will have on your conversion rate. Next, locate the number of visitors needed PER recipe for a two-recipe test in the first grid of numbers. If you'd rather estimate based on number of conversions in the baseline recipe then look at the second set of numbers, or else the number conversions in the challenger in the third set of numbers. (click to open larger image in new window) Overall, the smaller the effect size you need to detect, the more traffic you need.