
Election Forecasts - FiveThirtyEight Blog - NYTimes.com. The Signal and the Noise: Why So Many Predictions Fail — but Some Don't (9781594204111): Nate Silver. The Signal and the Noise. Explaining Odds Ratios. T Distribution Calculator. The t distribution calculator makes it easy to compute cumulative probabilities, based on t statistics; or to compute t statistics, based on cumulative probabilities.
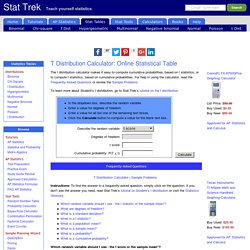
For help in using the calculator, read the Frequently-Asked Questions or review the Sample Problems. To learn more about Student's t distribution, go to Stat Trek's tutorial on the t distribution. Instructions: To find the answer to a frequently-asked question, simply click on the question. If you don't see the answer you need, read Stat Trek's tutorial on Student's t distribution or visit the Statistics Glossary. Which random variable should I use - the t score or the sample mean"? The t distribution calculator accepts two kinds of random variables as input: a t score or a sample mean. If you choose to work with t statistics, you may need to transform your raw data into a t statistic. For an example that uses t statistics, see Sample Problem 1. What are degrees of freedom? Online Tutorials: Statistics and Matrix Algebra.
Box Plot: Display of Distribution. Click here for box plots of one or more datasets They are different, but not different enough to matter -- like the maple leaves off the tree in my yard, when all I want to do is rake them up.
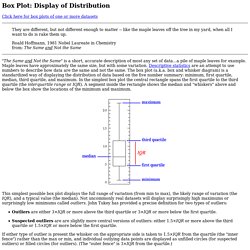
Roald Hoffmann, 1981 Nobel Laureate in Chemistry from: The Same and Not the Same "The Same and Not the Same" is a short, accurate description of most any set of data...a pile of maple leaves for example. Maple leaves have approximately the same size, but with some variation. Descriptive statistics are an attempt to use numbers to describe how data are the same and not the same.
This simplest possible box plot displays the full range of variation (from min to max), the likely range of variation (the IQR), and a typical value (the median). Outliers are either 3×IQR or more above the third quartile or 3×IQR or more below the first quartile. If the data happens to be normally distributed, IQR = 1.35 σ where σ is the population standard deviation.
Example A Consider two datasets: Example B Example C. Should Alice marry Bob? Two problems: 1.

You are in an airport and are walking from the main departure lounge to a rather distant gate. On the way there are several moving walkways. There is a small stone in your shoe, which is annoying enough that you decide that you must remove it. If you want to get to the gate as quickly as possible, and if there is no danger of your annoying other passengers, is it better to remove the stone while on a moving walkway or while on stationary ground, or does it make no difference?
2. And which of those two questions did you find more engaging? Recently, the government has expressed a wish that all schoolchildren should study mathematics up to the age of 18, a view that appears to have cross-party support. One method that is sometimes proposed for making subjects more appealing is to make them ‘relevant’. But problems like that don’t feel relevant at all. What is it that gives the stone-in-shoe question its appeal? We often need to make decisions based on incomplete data. 1. 2012 General Election: Romney vs. Obama. Heart Disease and Stroke Statistics—2012 Update. US Election. Stærðfræðikunnátta er styrkur. How It Works. The site provides two different types of information.
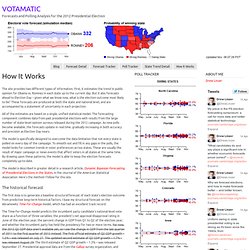
First, it estimates the trend in public opinion for Obama vs. Romney in each state up to the current day. But it also forecasts ahead to Election Day – given what we know now, what is the election outcome most likely to be? These forecasts are produced at both the state and national level, and are accompanied by a statement of uncertainty in each projection. All of the estimates are based on a single, unified statistical model.
The model is specifically designed to overcome the data limitation that not every state is polled on every day of the campaign. The model is described in greater detail in a research article, Dynamic Bayesian Forecasting of Presidential Elections in the States, in the Journal of the American Statistical Association. The historical forecast The first step is to generate a baseline structural forecast of each state’s election outcome from predictive long-term historical factors. Updating from pre-election polls.