
External Resources — Matplotlib 1.5.0 documentation. Shapefiles. IntroductionWhat is a shapefile?
Drawing shapefilesQuerying shapefilesRelevant Environment VariablesWriting shapefilesExamplesCaveat Introduction GrADS version 2.0.a8 introduced the new capability to draw and query the contents of a shapefile; version 2.0.a9 added the capability to create new shapefiles from GrADS gridded or station data sets. This documentation page serves as an overview of the GrADS shapefile inteface, providing guidance on what shapefiles are, how to find out what they contain, how to draw their contents, and how to create new shapefiles.
What is a Shapefile? The shapefile format (promulgated by ESRI) stores non-topological geometry and attribute information for the spatial features in a data set. Some resources for freely available shapefiles are: Drawing Shapefiles GrADS will draw the contents of a shapefile as an overlay on top of an existing plot with the command draw shp. Python - How to make 'fuller' axis arrows with matplotlib. Mathemathinking: Basemap: Toolkit in Python for plotting data on maps. I found a cool package in Python for plotting data on maps.
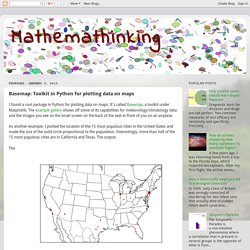
It's called Basemap, a toolkit under Matplotlib. The example gallery shows off some of its capabilities for meteorology/climatology data and the images you see on the small screen on the back of the seat in front of you on an airplane. As another example, I plotted the location of the 15 most populous cities in the United States and made the size of the solid circle proportional to the population. Interestingly, more than half of the 15 most populous cities are in California and Texas. The output: The code is below. Matplotlib Basemap tutorial 07: Shapefiles unleached. API Documentation. Try it now.
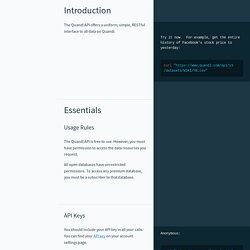
For example, get the entire history of Facebook's stock price to yesterday: curl " curl " curl " The Quandl API offers a uniform, simple, RESTful interface to all data on Quandl. Usage Rules The Quandl API is free to use. All open databases have unrestricted permissions. API Keys Anonymous: Authenticated: curl " curl " curl " You should include your API key in all your calls. Requests without an API key (anonymous requests) are accepted, but subject to strict rate limits. Rate Limits Anonymous requests are subject to a limit of 50 calls per day. The Ren'Py Visual Novel Engine. Python Programming Tutorials. Matplotlib Data Visualization Progress: 0% Welcome to another Basemap with Matplotlib tutorial.
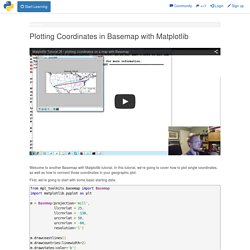
In this tutorial, we're going to cover how to plot single coordinates, as well as how to connect those coordinates in your geographic plot. Python Programming Tutorials. Axes. X : array_like, shape (n, m) or (n, m, 3) or (n, m, 4) Display the image in X to current axes.
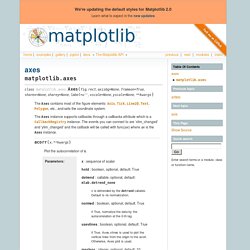
X may be a float array, a uint8 array or a PIL image. If X is an array, it can have the following shapes:MxN – luminance (grayscale, float array only)MxNx3 – RGB (float or uint8 array)MxNx4 – RGBA (float or uint8 array)The value for each component of MxNx3 and MxNx4 float arrays should be in the range 0.0 to 1.0; MxN float arrays may be normalised. cmap : Colormap, optional, default: None If None, default to rc image.cmap value. cmap is ignored when X has RGB(A) information aspect : [‘auto’ | ‘equal’ | scalar], optional, default: None If ‘auto’, changes the image aspect ratio to match that of the axes.If ‘equal’, and extent is None, changes the axes aspect ratio to match that of the image. Matplotlib Basemap tutorial 07: Shapefiles unleached. Plotting data on a map (Example Gallery) — Basemap Matplotlib Toolkit 1.0.8 documentation. Following are a series of examples that illustrate how to use Basemap instance methods to plot your data on a map.
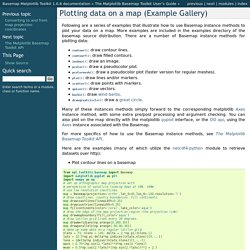
More examples are included in the examples directory of the basemap source distribution. There are a number of Basemap instance methods for plotting data: contour(): draw contour lines.contourf(): draw filled contours.imshow(): draw an image.pcolor(): draw a pseudocolor plot.pcolormesh(): draw a pseudocolor plot (faster version for regular meshes).plot(): draw lines and/or markers.scatter(): draw points with markers.quiver(): draw vectors.barbs(): draw wind barbs.drawgreatcircle(): draw a great circle. Many of these instances methods simply forward to the corresponding matplotlib Axes instance method, with some extra pre/post processing and argument checking.
You can also plot on the map directly with the matplotlib pyplot interface, or the OO api, using the Axes instance associated with the Basemap. Python Programming Tutorials. Python for Scientific Computing. Documentation — pygal 2.0.0 documentation. Python Programming Tutorials. Automate the Boring Stuff with Python. Lesson 13 - Lists, Indexes, Slices, and the list() Function One more topic you’ll need to understand before you can begin writing programs in earnest is the list data type and its cousin, the tuple.
Lists and tuples can contain multiple values, which makes it easier to write programs that handle large amounts of data. And since lists themselves can contain other lists, you can use them to arrange data into hierarchical structures. In this chapter, I’ll discuss the basics of lists. I’ll also teach you about methods, which are functions that are tied to values of a certain data type. A list is a value that contains multiple values in an ordered sequence. >>> [1, 2, 3] [1, 2, 3] >>> ['cat', 'bat', 'rat', 'elephant'] ['cat', 'bat', 'rat', 'elephant'] >>> ['hello', 3.1415, True, None, 42] ['hello', 3.1415, True, None, 42] ➊ >>> spam = ['cat', 'bat', 'rat', 'elephant'] >>> spam ['cat', 'bat', 'rat', 'elephant'] The spam variable ➊ is still assigned only one value: the list value.