
Highcharts - Interactive JavaScript charts for your webpage. CHarts. Visualizing Player makes it easier to share visualization. It's easy to share static graphics.
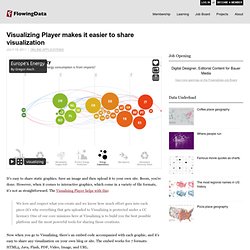
Save an image and then upload it to your own site. Boom, you're done. However, when it comes to interactive graphics, which come in a variety of file formats, it's not as straightforward. The Visualizing Player helps with this:
Cartographie réseaux. Juice Analytics - Home Page. The 12 Days of Christmas, as referenced in the song, starts in most traditions on Christmas Day and ends on January 6.
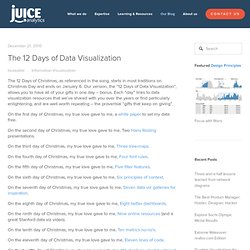
Our version, the “12 Days of Data Visualization”, allows you to have all of your gifts in one day -- bonus. Each “day” links to data visualization resources that we’ve shared with you over the years or find particularly enlightening, and are well worth repeating -- the proverbial “gifts that keep on giving”. On the first day of Christmas, my true love gave to me, a white paper to set my data free. On the second day of Christmas, my true love gave to me, Two Hans Rosling presentations.
Timeline.