
22 free tools for data visualization and analysis. Review April 20, 2011 06:00 AM ET Computerworld - You may not think you've got much in common with an investigative journalist or an academic medical researcher.
But if you're trying to extract useful information from an ever-increasing inflow of data, you'll likely find visualization useful -- whether it's to show patterns or trends with graphics instead of mountains of text, or to try to explain complex issues to a nontechnical audience. Want to see all the tools at once?
For quick reference, check out our chart listing all the tools profiled here. There are many tools around to help turn data into graphics, but they can carry hefty price tags. Related Blog Here's a rundown of some of the better-known options, many of which were demonstrated at the Computer-Assisted Reporting (CAR) conference last month. Learning How To Visualize. Been getting a ton of requests for ‘how to’s and guides for creating decent visualizations and information designs.
Made me think: maybe I could do some workshops in this area. I like developing ideas and working with people. Could be fun! So if you think you’d like to attend a workshop on visualization or organize one for your organisation, please fill in this quick form (30 seconds). In the meantime, you might be interested in a section I’ve been building in a far-flung corner of the site. The most recent one explores the stages we went through creating an infographic for Wired magazine about planets in other solar systems – or “exoplanets”. (Microscopic, dark and unimaginably far away, these tiny celestial objects should be impossible to spot.
Here’s how we created it. Timelines: TimeTravel in TV and Film Yup, we went through 36 drafts of this. Statistics Help for Journalists. Numbers can't "talk," but they can tell you as much as your human sources can.

But as with human sources, you have to ask! So what should you ask a number? Well, mathematicians have developed an entire field — statistics — dedicated to getting answers out of numbers. Now, you don't have to have a degree in statistics in order to conduct an effective "interview" with your data. But you do need to know a few basics. In 1996, I first published Statistics Every Writer Should Know, an online tutorial for math-phobic journalists. Running a business demands at least a basic knowledge of math and math concepts, so I'm including this tutorial as an appendix my 2012 book, How to Make Money Publishing Community News Online. Here, described in plain English, are some basic concepts in statistics that every writer should know...
Where should an aspiring data journalist start? In writing last week’s Guardian Data Blog piece on How to be a data journalist I asked various people involved in data journalism where they would recommend starting.
The answers are so useful that I thought I’d publish them in full here. The Telegraph’s Conrad Quilty-Harper: Start reading: Keep adding to your knowledge and follow other data journalists/people who work with data on Twitter. Look for sources of data: ONS stats release calendar is a good start Look at the Government data stores (Data.gov, Data.gov.uk, Data.london.gov.uk etc). Check out What do they know, Freebase, Wikileaks, Manyeyes, Google Fusion charts. Find out where hidden data is and try and get hold of it: private companies looking for publicity, under appreciated research departments, public bodies that release data but not in a granular form (e.g.
Code. How to be a data journalist. Data journalism is huge.
I don't mean 'huge' as in fashionable - although it has become that in recent months - but 'huge' as in 'incomprehensibly enormous'. It represents the convergence of a number of fields which are significant in their own right - from investigative research and statistics to design and programming. The idea of combining those skills to tell important stories is powerful - but also intimidating. Who can do all that? The reality is that almost no one is doing all of that, but there are enough different parts of the puzzle for people to easily get involved in, and go from there. 1. 'Finding data' can involve anything from having expert knowledge and contacts to being able to use computer assisted reporting skills or, for some, specific technical skills such as MySQL or Python to gather the data for you. 2. 3. 4.
Tools such as ManyEyes for visualisation, and Yahoo! Data journalism - étude de cas - GUARDIAN.
How to analyze unfamiliar data: circle, dive, and riff. When you come face to face with unfamiliar data, how do you proceed?
How do you avoid sending yourself and your shiny “speed of thought” tool slamming into a dead end? Dan Murray’s got a routine — and he’s also got certain music and right-brained books to go along. Dan’s first rule: “Don’t pre-think.” It’s the hardest thing for people to learn, he says. “If you go into [data analysis] thinking you know where you’re going, you easily miss the granule of gold.” He’s the chief operating officer and heavy-hitting data analyst at InterWorks, Inc., an Oklahoma-based business consultancy. From an airport somewhere in the South, he explains, “You have to think like a writer thinks. He’s been analyzing data ever since spreadsheets first became available in the early ’80s. The routine goes something like this. First, get the big picture. Look for what pops out. Find groups. 1 - LES LIENS DU LIVRE - Data journalism.
Data journalism training – some reflections. I recently spent 2 days teaching the basics of data journalism to trainee journalists on a broadsheet newspaper.
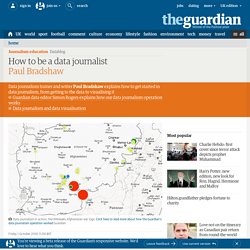
It’s a pretty intensive course that follows a path I’ve explored here previously – from finding data and interrogating it to visualizing it and mashing – and I wanted to record the results. My approach was both practical and conceptual. Conceptually, the trainees need to be able to understand and communicate with people from other disciplines, such as designers putting together an infographic, or programmers, statisticians and researchers. They need to know what semantic data is, what APIs are, the difference between a database and open data, and what is possible with all of the above. They need to know what design techniques make a visualisation clear, and the statistical quirks that need to be considered – or looked for. Journalism in the Age of Data: A Video Report on Data Visualization by Geoff McGhee. Mirko Lorenz. Data journalism training – some reflections. How to: get to grips with data journalism. A graph showing the number of IEDs cleared from the Afghanistan War Logs Only a couple of years ago, the idea that journalists would need to know how to use a spreadsheet would have been laughed out of the newsroom.
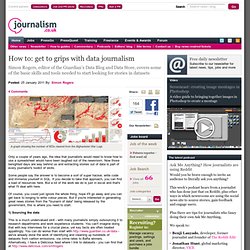
Now those benighted days are way behind us and extracting stories out of data is part of every journalist's toolkit of skills. Some people say the answer is to become a sort of super hacker, write code and immerse yourself in SQL. If you decide to take that approach, you can find a load of resources here. But a lot of the work we do is just in excel and that's what I'll deal with here. Of course, you could just ignore the whole thing, hope it'll go away and you can get back to longing to write colour pieces. 1) Sourcing the data This is a much undervalued skill - with many journalists simply outsourcing it to research departments and work experience students. But broadly, the general approach is to look for the most authoritative place for your data.