
Learn the art of Mind Mapping. Mapplications “What is a Mind Map?”

A Mind Map® is a powerful way of expressing the thought patterns, pictures and associations that already exist in the brain. It is an expression of Radiant Thinking which is a natural function of the human mind. Benefits of Mind MapsBrainstorm creative ideas quickly and easilyMake better decisionsTake fast effective notes in meetingsMake concise notes from books, documents, reports and other printed materialPrepare and present documents etc.Study better and remember moreThink through problems and find the best solution How to Read Mind MapsOn Mind Maps, ideas and thoughts are shown as coloured images and key words branching out from a central theme.
One of the key benefits of Mind Maps® is that they help you to see how ideas link to each other as well as how they relate to the central theme. Have a look at the mind map below about Joe’s retirement speech. 1. Mind Map Art. Mind Map disegnate a mano: un álbum de Flickr. Free mind map library - Biggerplate mind maps and mind map templates.
Tony Buzan. DeBono 6Hats Resources (Posters and Handouts) Free downloads. Why 6 Hats?

Because the human brain thinks in a number of distinct ways we can develop strategies for thinking about particular issues. Dr de Bono identifies six distinct states that the brain can focus on. In each of these states the brain will identify and bring into conscious thought certain aspects of issues being considered (e.g. gut instinct, pessimistic judgment, neutral facts).
Six distinct states are identified and assigned a color:Information: (White) - considering purely what information is available, what are the facts? Emotions (Red) - instinctive gut reaction or statements of emotional feeling (but not any justification)Bad points judgment (Black) - logic applied to identifying flaws or barriers, seeking mismatchGood points judgment (Yellow) - logic applied to identifying benefits, seeking harmonyCreativity (Green) - statements of provocation and investigation, seeing where a thought goesThinking (Blue) - thinking about thinking. How to Create Awesome Infographics. Even if information is highly out of ordinary and attention-grabbing, if your content contains lengthy plain text without illustration or images whatsoever, the entire page becomes dull and unimaginative.
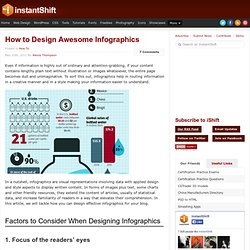
To sort this out, infographics help in routing information in a creative manner and in a style making your information easier to understand. In a nutshell, infographics are visual representations involving data with applied design and style aspects to display written content. In forms of images plus text, some charts and other friendly resources, they extend the content of articles, usually of statistical data, and increase familiarity of readers in a way that elevates their comprehension. In this article, we will tackle how you can design effective infographics for your blog.
Factors to Consider When Designing Infographics 1. Infographics raise awareness whereby people can relate and understand the subject matter better. 2. 3. 10 Awesome Free Tools To Make Infographics. Advertisement Who can resist a colourful, thoughtful venn diagram anyway?

In terms of blogging success, infographics are far more likely to be shared than your average blog post. This means more eyeballs on your important information, more people rallying for your cause, more backlinks and more visits to your blog. In short, a quality infographic done well could be what your blog needs right now. Designing An Infographic Some great tips for designing infographics: Keep it simple! Ideas for infographic formats include: Timelines;Flow charts;Annotated maps;Graphs;Venn diagrams;Size comparisons;Showing familiar objects or similar size or value. Here are some great tutorials on infographic creation: Creating Your Infographic.