
How to create a colorful Infographic in Adobe Illustrator. Program: Illustrator CS& CC-2015Difficulty: IntermediateTag: Inphography, banners, graphic, number, colorful, diagram, steps.Estimated time: 30 minutes Sometimes we need to communicate difficult information or that might seem boring at first, but if we put it inside an inphographic we can make it more appealing.
By the use of graphics, icons or even illustrations we can present the information in a clear way, making reading way easier to understand and retain. So today, we are going to learn how to create a numeric inphographic which we will use to get a clear vision of a theme. So let’s get stated! Last year, 28-year-old Matt Scanlan carried $2 million in cash, packed into flimsy plastic grocery bags, into the Gobi Desert.
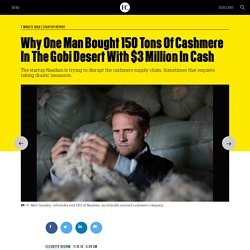
He had transferred the money to a bank in Ulaanbaatar, the capital of Mongolia, but when he arrived after flying 20 hours from New York, he discovered that no single bank would give him all the money at once. So he shuttled around to six different locations where tellers gave him bags and bags of bundled-up cash. He proceeded to pack all of it into a land cruiser, to prepare for another 20 hours of driving along dusty dirt roads to get to goat herders who would sell him raw cashmere. The Psychology of Color [Infographic] Content Marketing Infographic. The Art of Dressing Like A Gentleman: 26 Charts Every Man Needs To See. The art of dressing like a real gentleman isn’t as hard as you think — and it’s definitely rewarding as Pulptastic tells us.
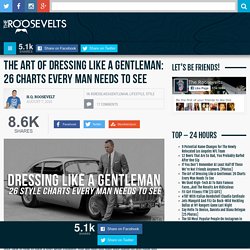
Below you’ll see 26 charts, ranging from how to properly pick sunglasses that fit your face to how to pack a shirt while traveling, that will help you step your game up and have you feeling like James Bond. Don’t forget to celebrate with a Cuban cigar. Infographic On Internet Addiction - How Important Is Internet In Our Lives? Broadband Expert Internet Addiction Infographic Use this infographic on your site: Expert Reviews Find out how we rate the top service providers See Reviews Savings Calculator Are you overpaying for your TV & Internet services?
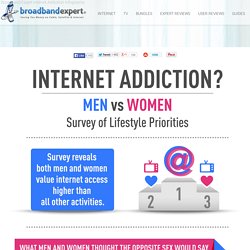
View Savings User Reviews Find out what others have to say about their providers See Reviews. 72 Groom Pocket Square Designs You Didn't Know About. Hey all you soon-to-be-grooms!
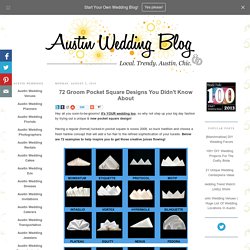
It's YOUR wedding too, so why not step up your big day fashion by trying out a unique & new pocket square design! Having a regular (formal) tucked-in pocket square is soooo 2008, so buck tradition and choose a fresh hankie concept that will add a fun flair to the refined sophistication of your tuxedo. Below are 72 examples to help inspire you to get those creative juices flowing! Which one is your favorite? How to Match Shirt and Tie Patterns. An Illustrated Guide To The Galaxy Of Women's Shoes. The Alarming Reality Behind How Advertisers Lie To Us. Infographic Confirms It: Advertising People Are Not Normal. Those who work in advertising often wonder if they live in a sort of bubble.
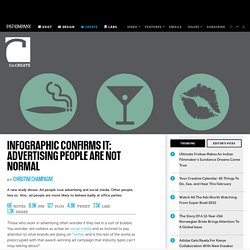
You wonder, are civilians as active on social media and as inclined to pay attention to what brands are doing on Twitter, and is the rest of the world as preoccupied with that award-winning ad campaign that industry types can’t stop talking about? The unsurprising answer is no, according to a study commissioned by San Francisco-based advertising agency Heat and conducted this past March by iThink, which found that people who work in advertising and marketing are worlds apart from the "normal" people when it comes to how they use social media and how they view social media marketing.
By the way, the survey also revealed that ad professionals tend to engage in more bad behavior at office holiday parties. More on that later. Créer des infographies. True-size-of-africa.jpg (JPEG Image, 2482 × 1755 pixels) - Scaled (58%) The Quest to Power Africa African Electricity and Renewable Energy. Nonmonogamy2.5.gif (GIF Image, 1500 × 1186 pixels) - Scaled (97%) 15 beautifully illustrated infographics for your inspiration. Cut down your exam stress by using our latest PK0-003 and high quality 642-746 and SK0-003 demos.
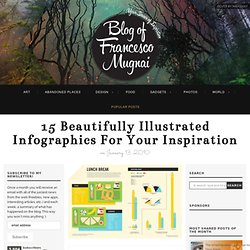
We provide updated HP2-Z18 questions with 100% pass guarantee along with JN0-660. Worksheets. Kitchen Cheat Sheet. 18 Amazing Body Hacks That Will Improve Your Life. 12 Foolproof Way to Hang Your Favourite Pictures. Staring at a blank wall, it can be hard to decide the best way to arrange your family photos and favourite artworks.
Follow these 12 foolproof picture arrangements and you can't go wrong. 1. Rising Symmetry This balanced, symmetrical approach to hanging pictures works wonderfully when it follows a stair. The diagonal of the stair helps to break to monotony and predictability of the reverse 'pyramid' arrangement. Enhanced-buzz-32194-1384374527-16.jpg (JPEG Image, 600 × 7583 pixels)
History of Web Browsers. Famous Personality Types. The-gay-marriage-world-map1.png (PNG Image, 720 × 9875 pixels) - Scaled (10%) Sign in. Comment créer une infographie efficace et viralisable. Créer une infographie. Graphisme Archives - Page 7 of 18 - Allweb2. Créer des infographies. 50 Incredible Facts About Skin. 7 Day Plan to Stay Productive. How to Eat Pussy. Looking for more information and cute illustrations on how to eat pussy?
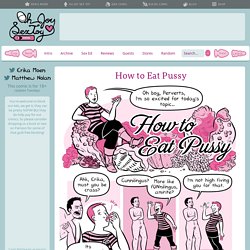
We recommend Box Lunch, a small but lovely and informative pocket guide with adorable illustrations. Scarleteen has thorough, in-depth articles on using barriers for all your various sexual activities, including dental dams for cunnilingus. Check out: All the Barriers! Equivalents and Measures. The Inverted Euphemism - by: Grant David Anderson II - [G.D. Anderson II - Enterprises Un-LTD]: How To Choose a Cigar. The world of cigars is a large daunting place.
![The Inverted Euphemism - by: Grant David Anderson II - [G.D. Anderson II - Enterprises Un-LTD]: How To Choose a Cigar](http://cdn.pearltrees.com/s/pic/th/inverted-euphemism-enterprises-24710786)
To be perfectly honest, I'm tired of answering the same questions over and over so I made this info-graphic. After the widespread success of my "How to Tip in a Bar" I figured it was worth a shot. Visual Data. This Infographic Shows the Phytonutrients You Need to Stay Healthy. Our Work - Post Typography. How to use FUROSHIKI. Click click click click. Become more productive. Image is Everything: The Secrets of Body Language.
Share this infographic on your site! <a href=” src=” alt=”Body Language” width=”500″ border=”0″ /></a><br />Source: <a href=” Image is Everything: The Secrets of Body Language. Are You Gay? The Answer May Surprise You. No, it’s not a lame BuzzFeed quiz. This is actual science. Check it out and share with your friends (because they might be curious, too). Infographic source. Computer-hardware-poster-972.jpg (JPEG Image, 972 × 1377 pixels) Artworks. G2FWBc_11Parts-72.jpg (JPEG Image, 800 × 3650 pixels) Simple Science Fitness. Burn Fat & Build Muscle for Healthy Humans. Infographics color palette. Infographics. Data Visualization, Information Design and Infographics. Infographic Design Agency – Hire Expert Infographic Designers.
Infographics & Data Visualization. Infographics.