
Lévy process. The most well known examples of Lévy processes are Brownian motion and the Poisson process.
Six Sigma. The common Six Sigma symbol Six Sigma is a set of techniques and tools for process improvement.
It was developed by Motorola in 1986.[1][2] Jack Welch made it central to his business strategy at General Electric in 1995.[3] Today, it is used in many industrial sectors.[4] Six Sigma seeks to improve the quality of process outputs by identifying and removing the causes of defects (errors) and minimizing variability in manufacturing and business processes.
It uses a set of quality management methods, mainly empirical, statistical methods, and creates a special infrastructure of people within the organization ("Champions", "Black Belts", "Green Belts", "Yellow Belts", etc.) who are experts in these methods. Six Sigma. Six Sigma (6σ) ist ein Managementsystem zur Prozessverbesserung, statistisches Qualitätsziel und zugleich eine Methode des Qualitätsmanagements.

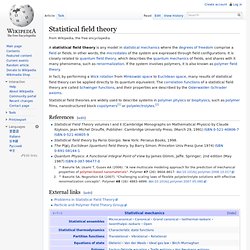
Quantum Statistics Concepts. Skewness. Example of experimental data with non-zero (positive) skewness (gravitropic response of wheatcoleoptiles, 1,790) In probability theory and statistics, skewness is a measure of the asymmetry of the probability distribution of a real-valued random variable about its mean.
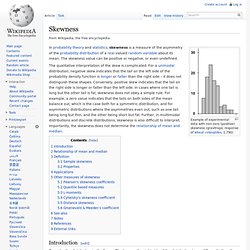
The skewness value can be positive or negative, or even undefined. The qualitative interpretation of the skew is complicated. For a unimodal distribution, negative skew indicates that the tail on the left side of the probability density function is longer or fatter than the right side – it does not distinguish these shapes. Conversely, positive skew indicates that the tail on the right side is longer or fatter than the left side. Statistical distance. A distance between populations can be interpreted as measuring the distance between two probability distributions and hence they are essentially measures of distances between probability measures.
Where statistical distance measures relate to the differences between random variables, these may have statistical dependence,[1] and hence these distances are not directly related to measures of distances between probability measures. Again, a measure of distance between random variables may relate to the extent of dependence between them, rather than to their individual values.
Distances as metrics[edit] Metrics[edit] d : X × X → R. Characteristic state function. In particular, if the partition function P satisfies or in which Q is a thermodynamic quantity, then Q is known as the "characteristic state function" of the ensemble corresponding to "P".
Beta refers to the thermodynamic beta. The microcanonical ensemble satisfies hence, its characteristic state function is .The canonical ensemble satisfies hence, its characteristic state function is the Helmholtz free energy .The grand canonical ensemble satisfies , so its characteristic state function is the Grand potential .The isothermal-isobaric ensemble satisfies so its characteristic function is the Gibbs free energy . Statistical field theory. Statistical field theories are widely used to describe systems in polymer physics or biophysics, such as polymer films, nanostructured block copolymers[1] or polyelectrolytes.[2] References[edit] Statistical Field Theory volumes I and II (Cambridge Monographs on Mathematical Physics) by Claude Itzykson, Jean-Michel Drouffe, Publisher: Cambridge University Press; (March 29, 1991) ISBN 0-521-40806-7 ISBN 0-521-40805-9Statistical field theory by Parisi Giorgio.
New York: Perseus Books, 1998.The P(φ)2 Euclidean (quantum) field theory. by Barry Simon. Princeton Univ Press (June 1974) ISBN 0-691-08144-1Quantum Physics: A Functional Integral Point of View by James Glimm, Jaffe. Cluster analysis. The result of a cluster analysis shown as the coloring of the squares into three clusters.
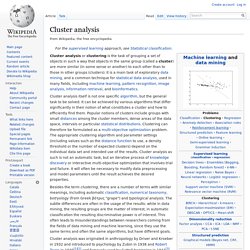
Cluster analysis or clustering is the task of grouping a set of objects in such a way that objects in the same group (called a cluster) are more similar (in some sense or another) to each other than to those in other groups (clusters). It is a main task of exploratory data mining, and a common technique for statistical data analysis, used in many fields, including machine learning, pattern recognition, image analysis, information retrieval, and bioinformatics.
Besides the term clustering, there are a number of terms with similar meanings, including automatic classification, numerical taxonomy, botryology (from Greek βότρυς "grape") and typological analysis. The subtle differences are often in the usage of the results: while in data mining, the resulting groups are the matter of interest, in automatic classification the resulting discriminative power is of interest.
Bernoulli process. In probability and statistics, a Bernoulli process is a finite or infinite sequence of binary random variables, so it is a discrete-time stochastic process that takes only two values, canonically 0 and 1.

The component Bernoulli variables Xi are identical and independent. Prosaically, a Bernoulli process is a repeated coin flipping, possibly with an unfair coin (but with consistent unfairness). Every variable Xi in the sequence is associated with a Bernoulli trial or experiment. They all have the same Bernoulli distribution. Much of what can be said about the Bernoulli process can also be generalized to more than two outcomes (such as the process for a six-sided die); this generalization is known as the Bernoulli scheme. Deception. Deception, beguilement, deceit, bluff, mystification and subterfuge are acts to propagate beliefs that are not true, or not the whole truth (as in half-truths or omission).
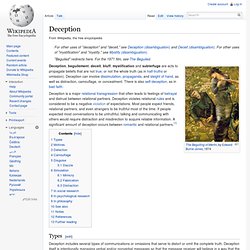
Deception can involve dissimulation, propaganda, and sleight of hand, as well as distraction, camouflage, or concealment. There is also self-deception, as in bad faith. Types[edit] Deception includes several types of communications or omissions that serve to distort or omit the complete truth. Deception itself is intentionally managing verbal and/or nonverbal messages so that the message receiver will believe in a way that the message sender knows is false. Misleading graph. In statistics, a misleading graph, also known as a distorted graph, is a graph which misrepresents data, constituting a misuse of statistics and with the result that an incorrect conclusion may be derived from it. Graphs may be misleading through being excessively complex or poorly constructed. Even when constructed to accurately display the characteristics of their data, graphs can be subject to different interpretation.[1]
How to Lie with Statistics. How to Lie with Statistics is a book written by Darrell Huff in 1954 presenting an introduction to statistics for the general reader. Huff was a journalist who wrote many "how to" articles as a freelancer, but was not a statistician. The book is a brief, breezy, illustrated volume outlining common errors, both intentional and unintentional, associated with the interpretation of statistics, and how these errors can lead to inaccurate conclusions. In the 1960s and '70s it became a standard textbook introduction to the subject of statistics for many college students. It has become one of the best-selling statistics books in history, with over one and a half million copies sold in the English-language edition.[1] It has also been widely translated. Themes of the book include "Correlation does not imply causation" and "Using random sampling". The original edition contained humorous illustrations by artist Irving Geis.
See also[edit] Misuse of statistics. A misuse of statistics occurs when a statistical argument asserts a falsehood. In some cases, the misuse may be accidental. In others, it is purposeful and for the gain of the perpetrator. When the statistical reason involved is false or misapplied, this constitutes a statistical fallacy. The false statistics trap can be quite damaging to the quest for knowledge. Statistical assumption. Statistical assumptions are general assumptions about statistical populations. Statistics, like all mathematical disciplines, does not generate valid conclusions from nothing. Generating interesting conclusions about real statistical populations usually requires some background assumptions. These must be made carefully, because incorrect assumptions can generate wildly inaccurate conclusions. The most commonly applied statistical assumptions are:[citation needed] Statistical model. A statistical model is a formalization of relationships between variables in the form of mathematical equations.
A statistical model describes how one or more random variables are related to one or more other variables. The model is statistical as the variables are not deterministically but stochastically related. Statistical inference. In statistics, statistical inference is the process of drawing conclusions from data that are subject to random variation, for example, observational errors or sampling variation.[1] Initial requirements of such a system of procedures for inference and induction are that the system should produce reasonable answers when applied to well-defined situations and that it should be general enough to be applied across a range of situations.
Inferential statistics are used to test hypotheses and make estimations using sample data. The outcome of statistical inference may be an answer to the question "what should be done next? ", where this might be a decision about making further experiments or surveys, or about drawing a conclusion before implementing some organizational or governmental policy.
Introduction[edit] Scope[edit] Checking whether a coin is fair. Dvoretzky–Kiefer–Wolfowitz inequality. The DKW inequality[edit] Siegel–Tukey test. In statistics, the Siegel–Tukey test, named after Sidney Siegel and John Tukey, is a non-parametric test which may be applied to data measured at least on an ordinal scale. It tests for differences in scale between two groups. The test is used to determine if one of two groups of data tends to have more widely dispersed values than the other. Kuiper's test. Jarque–Bera test. In statistics, the Jarque–Bera test is a goodness-of-fit test of whether sample data have the skewness and kurtosis matching a normal distribution. The test is named after Carlos Jarque and Anil K. Bera. Tajima's D. Statistische Physik. Die Statistische Physik beschäftigt sich mit der Beschreibung von Naturphänomenen, an denen zwar eine große Anzahl an Teilsystemen (z.B.
Teilchen) beteiligt ist, aber nur Aussagen über die Gesamtheit interessieren oder grundsätzlich nur eine unvollständige Information über das Detailverhalten der Teilsysteme vorhanden ist. Bedeutung[Bearbeiten] Die Statistische Physik ist eine fundamentale physikalische Theorie, deren mathematische Basis Sätze aus der Wahrscheinlichkeitstheorie und der asymptotischen Statistik, z.B. das Gesetz der großen Zahlen, sowie einige wenige physikalische Hypothesen bilden. Mit ihrer Hilfe werden u.a. Gesetze der Thermodynamik abgeleitet und begründet. Cramér–von Mises criterion. Molecular diffusion. Approximate entropy. Markov chain.