

Pournelle chart. The Pournelle chart The Pournelle chart, developed by Jerry Pournelle (in his 1963 political science Ph.D. dissertation), is a two-dimensional coordinate system which can be used to distinguish political ideologies.
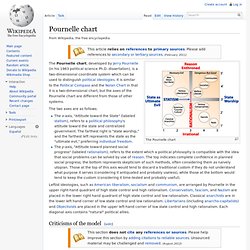
It is similar to the Political Compass and the Nolan Chart in that it is a two-dimensional chart, but the axes of the Pournelle chart are different from those of other systems. The two axes are as follows: The x-axis, "Attitude toward the State" (labeled statism), refers to a political philosophy's attitude toward the state and centralized government.
F-scale (personality test) The purpose of the F-scale is to measure an antidemocratic personality structure, usually defined by authoritarianism.
A score of above 80 on the F-scale test indicates that the subject may be suffering from severe psychopathology. Patients who suffer from repeated episodes of disorders usually get a higher F-scale score than those who have acute disorders. Besides, people who have a high F-scale score mostly likely have a lower educational level.[5] The scale specifically examines the following personality dimensions: F-scale tests measure not only the subject's overall level of stress but also his or her willingness to cooperate in the testing process.[7] Research in the late 1960s focused on police and the detection of authoritarianism. According to data presented by Levinson, a hypothesis was formed proposing that brighter people are capable of penetrating the significance of the F scale, helping them react in a more “suitable” fashion.
Political compass. This chart proposed by the Political Compass Organisation, which extends from -10 to +10 on each axis, is one of several competing models.
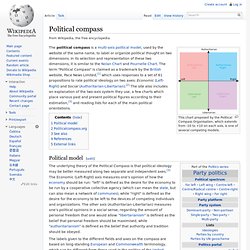
The political compass is a multi-axis political model, used by the website of the same name, to label or organize political thought on two dimensions. In its selection and representation of these two dimensions, it is similar to the Nolan Chart and Pournelle Chart. The term "Political Compass" is claimed as a trademark by the British website, Pace News Limited,[1] which uses responses to a set of 61 propositions to rate political ideology on two axes: Economic (Left-Right) and Social (Authoritarian-Libertarian).[2] The site also includes an explanation of the two-axis system they use, a few charts which place various past and present political figures according to their estimation,[3] and reading lists for each of the main political orientations. Nolan Chart. The Nolan chart, with the traditional left-right political spectrum on the dashed diagonal.
Development[edit] David Nolan Frustrated by the "left-right" line analysis that leaves no room for other ideologies, Nolan devised a chart with two axes which would come to be known as the Nolan Chart. Nolan-Diagramm. Das Nolan-Diagramm David Nolan 1996 mit dem erweiteren Nolan Chart Das Nolan-Diagramm (auch Nolan Chart) ist ein politisches Diagramm, das vom US-amerikanischen Politiker der Libertarian Party David Nolan entwickelt wurde.[1][2] Es basiert auf der Prämisse, dass individuelle Freiheit sowohl auf ökonomischem wie auch auf nicht-ökonomischem („gesellschaftlichem“) Gebiet existiert.
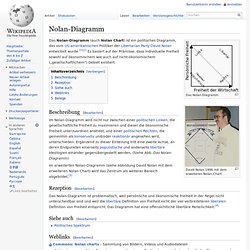
Beschreibung[Bearbeiten] Im erweiterten Nolan-Diagramm (siehe Abbildung David Nolan mit dem erweiteren Nolan Chart) wird das Zentrum als weiterer Bereich abgebildet.[3] Rezeption[Bearbeiten] Das Nolan-Diagramm ist problematisch, weil persönliche und ökonomische Freiheit in der Regel nicht unterscheidbar sind und weil die libertäre Definition von Freiheit nicht der viel verbreiteteren liberalen Definition von Freiheit entspricht. Siehe auch[Bearbeiten] Politisches Spektrum. Herkunft[Bearbeiten] Von Frankreich aus breitete sich die Links-rechts-Unterscheidung in ganz Europa aus.
In Deutschland konstituierte sich das Paulskirchenparlament von 1848 nach ihrem Muster. Hier saßen die republikanischen Abgeordneten, die einen sofortigen Sturz der damaligen Monarchie forderten, links und die Befürworter einer konstitutionellen Monarchie rechts. Typische Interpretationen[Bearbeiten] Der Gegensatz links-rechts steht im allgemeinen Verständnis stellvertretend für die nachfolgend beschriebenen Gegensätze. Egalitär – Elitär[Bearbeiten] Ausgehend vom Gleichheitspostulat (Egalité) der französischen Revolution sind egalitäre politische Ansätze zentral für das Selbstverständnis der „Linken“. Die „Rechte“ rechtfertigt die Notwendigkeit einer mehr oder weniger stark ausgeprägten Ungleichheit. Progressiv – Konservativ[Bearbeiten] In der Anfangszeit der westlichen Demokratien, insbesondere im 19. Internationalistisch – Nationalistisch[Bearbeiten] Bis in die Mitte des 20.
Political spectrum. A political spectrum is a system of classifying different political positions upon one or more geometric axes that symbolize independent political dimensions.
Most long-standing spectra include a right wing and left wing, which originally referred to seating arrangements in the French parliament after the Revolution (1789–99).[1] According to the simplest left–right axis, communism and socialism are usually regarded internationally as being on the left, opposite fascism and conservatism on the right. Liberalism can mean different things in different contexts, sometimes on the left (social liberalism), sometimes on the right (economic liberalism). Politics that rejects the conventional left–right spectrum is known as syncretic politics.[2][3] Those with an intermediate outlook are classified as centrists or moderates. Historical origin of the terms[edit] Originally, the defining point on the ideological spectrum was the ancien régime ("old order").
Academic investigation[edit] Leonard W.