
Fisher Snedecor. In probability theory and statistics, the F-distribution is a continuous probability distribution.[1][2][3][4] It is also known as Snedecor's F distribution or the Fisher–Snedecor distribution (after R.
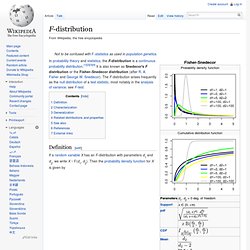
A. Fisher and George W. Snedecor). The F-distribution arises frequently as the null distribution of a test statistic, most notably in the analysis of variance; see F-test. Definition[edit] If a random variable X has an F-distribution with parameters d1 and d2, we write X ~ F(d1, d2). For real x ≥ 0. Is the beta function. The cumulative distribution function is where I is the regularized incomplete beta function. The expectation, variance, and other details about the F(d1, d2) are given in the sidebox; for d2 > 8, the excess kurtosis is The k-th moment of an F(d1, d2) distribution exists and is finite only when 2k < d2 and it is equal to [5] Weibull. In probability theory and statistics, the Weibull distribution /ˈveɪbʊl/ is a continuous probability distribution.
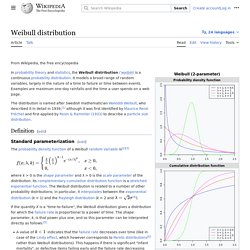
It is named after Swedish mathematician Waloddi Weibull, who described it in detail in 1951, although it was first identified by Fréchet (1927) and first applied by Rosin & Rammler (1933) to describe a particle size distribution. Definition[edit] Standard parameterization[edit] Rayleigh. In probability theory and statistics, the Rayleigh distribution /ˈreɪli/ is a continuous probability distribution for positive-valued random variables.
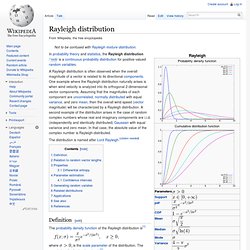
A Rayleigh distribution is often observed when the overall magnitude of a vector is related to its directional components. One example where the Rayleigh distribution naturally arises is when wind velocity is analyzed into its orthogonal 2-dimensional vector components. Assuming that the magnitudes of each component are uncorrelated, normally distributed with equal variance, and zero mean, then the overall wind speed (vector magnitude) will be characterized by a Rayleigh distribution.
A second example of the distribution arises in the case of random complex numbers whose real and imaginary components are i.i.d. (independently and identically distributed) Gaussian with equal variance and zero mean. Rice. Rayleigh. Gamma. In probability theory and statistics, the gamma distribution is a two-parameter family of continuous probability distributions.
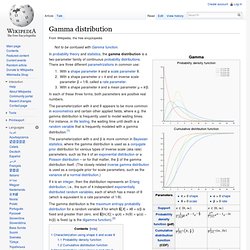
There are three different parametrizations in common use: With a shape parameter k and a scale parameter θ.With a shape parameter α = k and an inverse scale parameter β = 1/θ, called a rate parameter.With a shape parameter k and a mean parameter μ = k/β. In each of these three forms, both parameters are positive real numbers. The parameterization with k and θ appears to be more common in econometrics and certain other applied fields, where e.g. the gamma distribution is frequently used to model waiting times. For instance, in life testing, the waiting time until death is a random variable that is frequently modeled with a gamma distribution.[1] Characterization using shape k and scale θ[edit] A random variable X that is gamma-distributed with shape k and scale θ is denoted Probability density function[edit] Here Γ(k) is the gamma function evaluated at k. where If. Erlang. The Erlang distribution is a continuous probability distribution with wide applicability primarily due to its relation to the exponential and Gamma distributions.
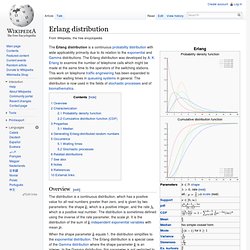
The Erlang distribution was developed by A. K. Erlang to examine the number of telephone calls which might be made at the same time to the operators of the switching stations. This work on telephone traffic engineering has been expanded to consider waiting times in queueing systems in general. Chi-square. The chi-squared distribution is used in the common chi-squared tests for goodness of fit of an observed distribution to a theoretical one, the independence of two criteria of classification of qualitative data, and in confidence interval estimation for a population standard deviation of a normal distribution from a sample standard deviation.
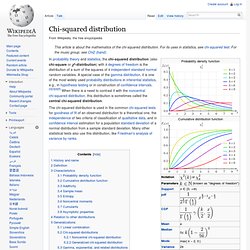
Many other statistical tests also use this distribution, like Friedman's analysis of variance by ranks. History and name[edit] This distribution was first described by the German statistician Friedrich Robert Helmert in papers of 1875/1876,[7] where he computed the sampling distribution of the sample variance of a normal population. Thus in German this was traditionally known as the Helmertsche ("Helmertian") or "Helmert distribution". Definition[edit] Rayleigh. Exponential. In probability theory and statistics, the exponential distribution (a.k.a. negative exponential distribution) is the probability distribution that describes the time between events in a Poisson process, i.e. a process in which events occur continuously and independently at a constant average rate.
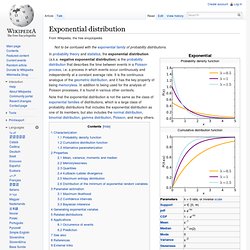
It is the continuous analogue of the geometric distribution, and it has the key property of being memoryless. In addition to being used for the analysis of Poisson processes, it is found in various other contexts. Note that the exponential distribution is not the same as the class of exponential families of distributions, which is a large class of probability distributions that includes the exponential distribution as one of its members, but also includes the normal distribution, binomial distribution, gamma distribution, Poisson, and many others.
Characterization[edit] Probability density function[edit]