
Project viability. D3 with AJAX? - d3-js. Positioning graph within div - d3-js. Force-Directed Layout (with tipsy labels) How to rerender after a filter() - d3-js. A template for rendering small NodeXL visualisations on the web using the d3.js. Having put in the toil getting my head around the d3.js library I wanted to revisit a problem I had rendering NodeXL generated data in a scalable vector graphic based webpage.
In my post The art of discovery: Looking at how UK Web Focus, OUseful.info and MASHe interconnect using Google Spreadsheets and NodeXL I said: In a recent post by Tony on Visualising New York Times Article API Tag Graphs Using d3.js he highlighted how there is NetworkX D3 helper library (networkx-d3) for the NetworkX visualisation package for Python. Not being a Python developer (yet) I thought it would be interesting to adapt the same philosophy for NodeXL. So after a bit more tweaking I get this rendering of a selection of interconnected posts: Do it yourself.
MASHe. Export example from NodeXL. Edit this Fiddle - jsFiddle - Online Editor for the Web (JavaScript, MooTools, jQuery, Prototype, YUI, Glow and Dojo, HTML, CSS) Svg - D3 Force-directed graph using texts instead of nodes. Arrowsm. Arrow at Link Target - d3-js. Tutorial: introduction to D3. Christopheviau.
Intro Data-Driven Documents, or D3 for short, is a new visualization library to build visualizations in SVG.
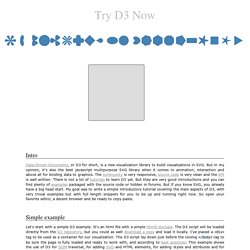
But in my opinion, it's also the best javascript multipurpose SVG library when it comes to animation, interaction and above all for binding data to graphics. The community is very responsive, source code is very clean and the API is well written. d3.js. Text doesn't append to node in force graph - d3-js. Interactive Force-Directed Layout (D3) 2011-D3-InfoVis.pdf. Positioning Nodes in force directed Graph - d3-js. Custom Force-Directed Graph nodes - d3-js.