

PRACTICA I. Espectro del heptano mostrando las vibraciones de tensión Espectro infrarrojo del alcohol sec-butílico.
Los aldehídos, las cetonas, los ácidos carboxílicos y sus derivados dan la banda del carbonilo, este grupo es uno de los que absorben fuertemente en la región del infrarrojo en la zona de 1850-1650 cm-1. En la serie de espectros de infrarrojo que se presentan al final de cada prácticaseñale las bandas de absorción característica que le darán la pauta para identificar un compuesto, señale además el tipo de vibración que corresponde a la banda. Estructura molecular de alcanos, alquenos, alquinos, aromáticos, alcoholes, aldehídos, cetonas, aminas, ácidos carboxílicos y ésteres. 1) ¿Cuáles son las principales bandas de absorción para un alcano en un espectro de IR?
2) ¿Cómo distingue un isopropilo de un terbutilo en un espectro de IR ? 3) ¿Cuándo un alcano tiene mas de 4 metilenos en linea, ¿cómo se le distingue en un espectro de IR? A) Fessenden R.J., Fessenden J.S. Química Orgánica 2a edición. Infrared Waves. Infrared light is even used to heat food sometimes - special lamps that emit thermal infrared waves are often used in fast food restaurants!
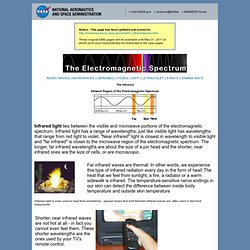
How can we "see" using the Infrared? Since the primary source of infrared radiation is heat or thermal radiation, any object which has a temperature radiates in the infrared. Even objects that we think of as being very cold, such as an ice cube, emit infrared. When an object is not quite hot enough to radiate visible light, it will emit most of its energy in the infrared.
For example, hot charcoal may not give off light but it does emit infrared radiation which we feel as heat. Humans may not be able to see infrared light, but did you know that snakes in the pit viper family, like rattlesnakes, have sensory "pits", which are used to image infrared light? Many things besides people and animals emit infrared light - the Earth, the Sun, and far away things like stars and galaxies do also! NMR Theory Tutorial. Spectroscopy Introduction - Introduction to Spectroscopy and Types of Spectroscopy. Cap 9- Espectroscopia infrarroja. Espectroscopiainfrarroja Monocromador Rayo de referencia.

Infrared Spectroscopy. Infrared Spectroscopy 1.
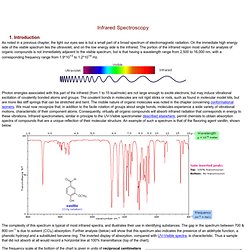
Introduction As noted in a previous chapter, the light our eyes see is but a small part of a broad spectrum of electromagnetic radiation. On the immediate high energy side of the visible spectrum lies the ultraviolet, and on the low energy side is the infrared. The portion of the infrared region most useful for analysis of organic compounds is not immediately adjacent to the visible spectrum, but is that having a wavelength range from 2,500 to 16,000 nm, with a corresponding frequency range from 1.9*1013 to 1.2*1014 Hz.
Photon energies associated with this part of the infrared (from 1 to 15 kcal/mole) are not large enough to excite electrons, but may induce vibrational excitation of covalently bonded atoms and groups. The complexity of this spectrum is typical of most infrared spectra, and illustrates their use in identifying substances. Infrared Spectrometry. The Nature of Vibrational Spectroscopy We have noted that the covalent bonds of molecules are not rigid , but are more like stiff springs that can be stretched and bent.
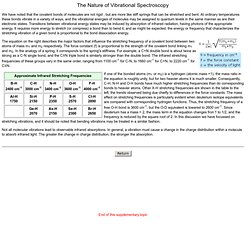
At ordinary temperatures these bonds vibrate in a variety of ways, and the vibrational energies of molecules may be assigned to quantum levels in the same manner as are their electronic states. Transitions between vibrational energy states may be induced by absorption of infrared radiation, having photons of the appropriate energy. It requires more energy to stretch (or compress) a bond than to bend it, and as might be expected, the energy or frequency that characterizes the stretching vibration of a given bond is proportional to the bond dissociation energy. The equation on the right describes the major factors that influence the stretching frequency of a covalent bond between two atoms of mass m1 and m2 respectively. Not all molecular vibrations lead to observable infrared absorptions. End of this supplementary topic. IR Spectroscopy Tutorial. Infrared Absorption Frequencies. Interpretation of Infrared Spectra The interpretation of infrared spectra involves the correlation of absorption bands in the spectrum of an unknown compound with the known absorption frequencies for types of bonds.
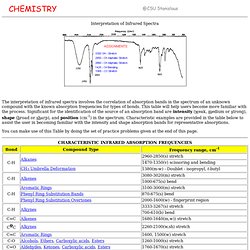
This table will help users become more familiar with the process. Significant for the identification of the source of an absorption band are intensity (weak, medium or strong), shape (broad or sharp), and position (cm-1) in the spectrum. Characteristic examples are provided in the table below to assist the user in becoming familiar with the intensity and shape absorption bands for representative absorptions. You can make use of this Table by doing the set of practice problems given at the end of this page. v - variable, m - medium, s - strong, br - broad, w - weak For steps to follow in the analysis of an infrared spectrum select this link ----> Quick Infrared Analysis Some Practice Problems comments to: j byrd jim@chem.csustan.edu.
Spectroscopy & Spectrometry.