
The MaxDiff Killer: Rank-Ordered Logit Models. Compared to MaxDiff (Sawtooth Software), ranked-order logit modeling:simplifies data collection without needing additional software to generate experimental designsreduces respondent burden making the task easier and seemingly fastercollects more data from individuals (complete ranking data for all alternatives) eliminates the expense of buying proprietary softwareenable us to be creative and mimic the purchase processmakes data analysis faster and less demandingestimates the impact of both respondent characteristics and alternative-specific variablesopens the door to using other R packages for additional analysis and graphical displaysI will not repeat my critique of MaxDiff scaling published in a previous post with the pithy title "Warning: Sawtooth's MaxDiff Is Nothing More Than a Technique for Rank Ordering Features!

" Instead, I want to bring to your attention an alternative to MaxDiff with all the positive features I have just listed. An Example Using Brand Preference. Warning: Sawtooth's MaxDiff Is Nothing More Than a Technique for Rank Ordering Features! Sawtooth Software has created a good deal of confusion with its latest sales video published on YouTube.

I was contacted last week by one of my clients who had seen the video and wanted to know why I was not using such a powerful technique for measuring attribute importance. "It gives you a ratio scale," he kept repeating. If SPSS can factor analyze MaxDiff scores, why can't R? Answer: The variance-covariance matrix containing all the MaxDiff scores is not invertible.

R tells you that, either with an error message or a warning. SPSS, at least earlier versions still in use, runs the factor analysis without comment. Engaging Market Research: Why doesn't R have a MaxDiff package? How to analyze Max Diff via R or SPSS.
Some Applications of Item Response Theory in R. The typical introduction to item response theory (IRT) positions the technique as a form of curve fitting.
We believe that a latent continuous variable is responsible for the observed dichotomous or polytomous responses to a set of items (e.g., multiple choice questions on an exam or rating scales from a survey). Literally, once I know your latent score, I can predict your observed responses to all the items. Our task is to estimate that function with one, two or three parameters after determining that the latent trait is unidimensional.
In the process of measuring individuals, we gather information about the items. Those one, two or three parameters are assessments of each item's difficulty, discriminability and sensitivity to noise or guessing. All this has been translated into R by William Revelle, and as a measurement task, our work is done. To be clear, these scales are meant to differentiate among individuals. Let’s Do Some MORE Hierarchical Bayes Choice Modeling in R! R enables us to "test drive" statistical models by running simulations and analyzing actual data.

We can look at the output and get some sense of how the whole thing works. The goal is to provide a realistic application that is not too difficult to follow: here is the data, next reformat that data into a form that the function can handle, now for the code to run the analysis and get the output, and finally a little interpretation. This was my motivation for the original post "Let's Do Some Hierarchical Bayes Choice Modeling in R! " (without the "more"). In that example, I varied pricing for two brands in a 3x3 complete factorial design and included a "Buy None of These" checkbox in order to measure demand. In addition, I allowed for alternative-specific effects by estimating the impact of price separately for the two brands. TURF Analysis: A Bad Answer to the Wrong Question. Now that R has a package performing Total Unduplicated Reach and Frequency (TURF) Analysis, it might be a good time to issue a warning to all R users.
DON'T DO IT! The technique itself is straight out of media buying from the 1950s. Given some number of n alternative advertising options (e.g., magazines), which set of size k will reach the most readers and be seen the most often? Unduplicated reach is the primary goal because we want everyone in the target audience to see the ad. In addition, it was believed that seeing the ad more than once would make the ad more effective (that is, until wearout), which is why frequency is a component.
What is Cluster Analysis? A Projective Test. Supposedly, projective tests (e.g., the inkblots of psychoanalysis) contain sufficient ambiguity that "what you see" reveals some aspect of your thinking that has escaped your awareness.
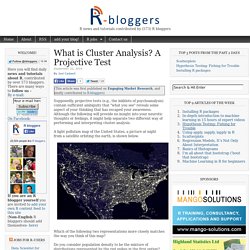
Although the following will provide no insight into your neurotic thoughts or feelings, it might help separate two different way of performing and interpreting cluster analysis. A light pollution map of the United States, a picture at night from a satellite orbiting the earth, is shown below. Which of the following two representations more closely matches the way you think of this map? Extracting Latent Variables from Rating Scales: Factor Analysis vs. Nonnegative Matrix Factorization. For many of us, factor analysis provides a gateway to learning how to run and interpret nonnegative matrix factorization (NMF).

This post will analyze a set of ratings on a 218 item adjective checklist using both principal axis factor analysis and NMF. The entire analysis will be performed in R using less than two dozen lines of code located at the end of this post. The R package mokken contains a dataset called acl with 433 students who looked at 218 adjectives and told us whether the adjectives described themselves using a 5-point rating scale from 0=completely disagree to 4=completely agree.
I borrowed this dataset because it has a sizable number of items so that it might pose a challenge for traditional factor analysis. Key Driver vs. Network Analysis in R. When marketing researchers speak of driver analysis, they are referring to an input-output model with overall satisfaction as the output and performance ratings of specific product and service components as the inputs.
The causal model is straightforward: brands provide the stuff customers want, customers see this and they are happy. What customers perceive is reported in their brand performance ratings (e.g., ease of use, low cost, and quality). Customer happiness is measured by an overall satisfaction rating or other output such as recommendation or retention. Finally, the R statistical programming language estimates the impact of changing inputs using any of its regression functions (e.g., the linear model function lm).
The machine analogy clarifies how we need predictors that are manipulated (as in an experiment) or at least measured independently of each other and the output. The authors note that these product and service perceptions were intended to be conceptually independent. Why doesn’t R have a MaxDiff package? Engaging Market Research: Incorporating Preference Construction into the Choice Modeling Process. Let’s Do Some Hierarchical Bayes Choice Modeling in R! It can be difficult to work your way through hierarchical Bayes choice modeling.

There is just too much new to learn. If nothing else, one gets lost in all ways that choice data can be collected and analyzed. Then there is all this output from the estimation procedure that you have probably never seen before. When Discrete Choice Becomes a Rating Scale: Constant Sum Allocation. Why limit our discrete choice task to next purchase when we can ask about next ten purchases? It does not seem appropriate to restrict choice modeling to one selection only when repeat purchases from the same choice set are made by the same individual buying different products at different times.
Similarly, a purchasing agent or a company buyer will make multiple purchases over time for different people. Engaging Market Research.