
If SPSS can factor analyze MaxDiff scores, why can't R? Answer: The variance-covariance matrix containing all the MaxDiff scores is not invertible.

R tells you that, either with an error message or a warning. SPSS, at least earlier versions still in use, runs the factor analysis without comment. I made two points in my last post. First, if you want to rank order your attributes, you do not need to spend $2,000 and buy Sawtooth's MaxDiff. A much simpler data collection procedure is available. So you can image my surprise when I received an email with the output from an SPSS factor analysis of MaxDiff scores. I asked that the sender run a multiple regression using SPSS with the MaxDiff scores as the independent variables. This is an example of why I am so fond of R. Now what? As an alternative, we could incorporate the constant sum constraint and move from a Euclidean to a simplex geometry, as suggested by the r package composition.
Warning: Sawtooth's MaxDiff Is Nothing More Than a Technique for Rank Ordering Features! Sawtooth Software has created a good deal of confusion with its latest sales video published on YouTube.

I was contacted last week by one of my clients who had seen the video and wanted to know why I was not using such a powerful technique for measuring attribute importance. "It gives you a ratio scale," he kept repeating. And that is what Sawtooth claims. At about nine minutes into the video, we are told that Maximum Difference Scaling yields a ratio scale where a feature with a score of ten is twice as important as a feature with a score of five. Where should I begin? 1. How to analyze Max Diff via R or SPSS. Maxdiff score across studies - Sawtooth Software Forum. How best to simulate MaxDiff responses - Sawtooth Software Forum. The right answer depends on the way you conduct the coding of the tasks to submit to logit analysis.

Best ways to compare large set Max Diff scores - Sawtooth Software Forum. We're currently looking into the same thing but in a slightly different way.
We've taken a previous study and removed data to create a sparse design (each statement seen once) and an incomplete design (some statements not seen). This lets us use the full design as a "Truth" baseline to compare the others to. We're then testing models with different prior DF and variance to tweak the amount of importance given to the top level model vs individual to see which are good fits (and have also started toying with using a covariate) We're comparing them by calculating and plotting the importances as usual, but also adding 90% CI's.
The various model estimates for each statement are plotted side by side. (3) What is the "Arrow's impossibility theorem" in layman's terms, and what is its practical significance? Arrow's Impossibility Theorem for Aggregating Individual Preferences into Social Preferences. Kenneth Arrow investigated the general problem of finding a rule for constructing social preferences from individual preferences.
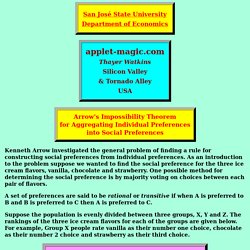
As an introduction to the problem suppose we wanted to find the social preference for the three ice cream flavors, vanilla, chocolate and strawberry. One possible method for determining the social preference is by majority voting on choices between each pair of flavors. A set of preferences are said to be rational or transitive if when A is preferred to B and B is preferred to C then A is preferred to C. Suppose the population is evenly divided between three groups, X, Y and Z.
The rankings of the three ice cream flavors for each of the groups are given below. Now consider how the vote would go among the three possible pairs of flavors. In a choice between vanilla and chocolate, the X groups would vote for vanilla, the Y group would also vote for vanilla and the Z group would vote for chocolate. Role_of_preference_axioms.pdf. Stated Preference Methods Using R.
By Hideo Aizaki, Tomoaki Nakatani, and Kazuo Sato Last update: Aug 11, 2014 This is the website for Stated Preference Methods Using R (SPMUR) published as a title of Chapman & Hall/CRC The R Series.
SPMUR explains how to apply stated preference (SP) methods such as contingent valuation (CV), discrete choice experiments (DCEs), and best-worst scaling (BWS) to elicit people's preferences using R. SPMUR focuses on introductory-level variants of three methods: single-bounded dichotomous choice and double-bounded dichotomous choice CV based on parametric and nonparametric approaches for analyzing responses; DCEs based on orthogonal main-effect designs (OMEDs) for designing choice situations and conditional and binary logit models for analyzing responses; and object case (case 1) BWS based on OMED or balanced incomplete block design for designing choice situation and counting and modeling approaches for analyzing responses.
FAQs 1. 2. R is available from CRAN. 3. 4. If SPSS can factor analyze MaxDiff scores, why can't R? Let's Do Some Hierarchical Bayes Choice Modeling in R! It can be difficult to work your way through hierarchical Bayes choice modeling.

There is just too much new to learn. If nothing else, one gets lost in all ways that choice data can be collected and analyzed. Then there is all this output from the estimation procedure that you have probably never seen before. Stated Preference Methods Using R. Spoffrp.pdf. Warning: Sawtooth's MaxDiff Is Nothing More Than a Technique for Rank Ordering Features! Max-Diff Experimental Design - Survey Analysis. A max-diff experimental design creates multiple lists of alternatives to be shown to respondents in multiple questions.
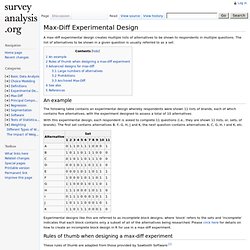
The list of alternatives to be shown in a given question is usually referred to as a set. An example The following table contains an experimental design whereby respondents were shown 11 lists of brands, each of which contains five alternatives, with the experiment designed to assess a total of 10 alternatives. With this experimental design, each respondent is asked to complete 11 questions (i.e., they are shown 11 lists, or, sets, of brands). The first set contains alternatives B, F, G, H, J and K, the next question contains alternatives A, C, G, H, I and K, etc. Experimental designs like this are referred to as incomplete block designs, where 'block' refers to the sets and 'incomplete' indicates that each block contains only a subset of all of the alternatives being researched. Category:Max-Diff - Survey Analysis. Max-Diff, which is also known as best-worst scaling, is a type of experiment used for measuring relative preferences.
Typically, respondents are shown a series of lists and are asked, when shown each list, to indicate which of the objects is 'best' and which is 'worst' (or, which is most preferred and which is least preferred). For example, a max-diff experiment measuring preferences for different colas may ask which is best and which is worst from: Coke, Pepsi, Diet Coke and Coke Zero. Then, in the second question a different list is shown (e.g., Pepsi, Coke Zero, Pepsi Lite and Dr Pepper). Analyzing Max-Diff Using Standard Logit Models Using R - Survey Analysis. R setup Install the mlogit package (see Installing R Packages).
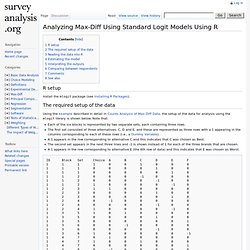
The required setup of the data Using the example described in detail in Counts Analysis of Max-Diff Data, the setup of the data for analysis using the mlogit library is shown below. Note that: Each of the six blocks is represented by two separate sets, each containing three rows. Reading the data into R This code reads in the example data shown above: trickedData = read.csv(' Estimating the model. Max-Diff Analysis Case Study Using R - Survey Analysis. This case study illustrates alternative approaches to analyzing Max-Diff data. Max-Diff Analysis and the links from that page should be read prior to this page. R setup Install the mlogit package and the BiasedUrn packages (see Installing R Packages). Counts Analysis of Max-Diff Data - Survey Analysis. Counts analysis involves counting up the number of times that objects are chosen as best and subtracting the number of times that they are chosen as worst.
Example Consider the following experimental design, where there are six blocks (sets), six alternatives, each alternative appears three times and each question presents respondents with three alternatives. block alternative 1 2 3 4 5 6 A 0 1 0 1 1 0 B 0 0 1 0 1 1 C 1 0 0 1 1 0 D 1 1 1 0 0 0 E 1 1 0 0 0 1 F 0 0 1 1 0 1 Consider the following choices: We can count up the number of times an alternative is chosen as best and the number of times it is chosen as worst, and the difference between these is the count.
Max-Diff Analysis Case Study Using R - Survey Analysis. Analyzing Max-Diff Using the Rank-Ordered Logit Model With Ties Using R - Survey Analysis. R Setup Install the BiasedUrn package (see Installing R Packages) and then paste the following code into R: Reading the data into R The code above assumes the data is in the stacked layout. Max-Diff Data File Layouts - Survey Analysis. There is no standard way of laying out the data from max-diff experiments. The following descriptions encapsulate some of common ways. None of these terms are standard. Example data In this example, we assume that the data has been collected with the following experimental design, where there are 4 alternatives, 5 blocks (i.e., questions) and 3 alternatives in every block:
Creating an Incomplete Block Design in R - Survey Analysis. Louviere_Flynn_Carson_Oct2010.pdf. MaxDiff Help > Analyzing MaxDiff Data > Aggregate Score Estimation via Logit Analysis. Note: Aggregate Logit has been used for more than three decades in the analysis of choice data. It is useful as a top-line diagnostic tool (both to assess the quality of the experimental design and to estimate the average preferences for the sample).
Randomized block design. Blocking to "remove" the effect of nuisance factors[edit] Design and Analysis of Experiments in the Health Sciences - Gerald van Belle, Kathleen F. Kerr. AlgDesign.pdf. Cran.r-project.org/web/packages/AlgDesign/vignettes/AlgDesign.pdf. OptBlock {AlgDesign} Description. AlgDesign.pdf.