
Banioras Tasos
Moocs. Csd. Educational technologies. Best interactive representations. An Overview of the Euro Crisis - Interactive Graphic. Arrows show imbalances of debt exposure between borrowers in one country and banks in another; arrows point from debtors to their bank creditors.
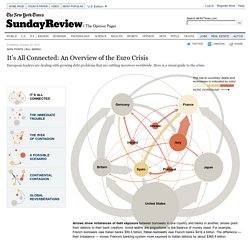
Arrow widths are proportional to the balance of money owed. For example, French borrowers owe Italian banks $50.6 billion; Italian borrowers owe French banks $416.4 billion. The difference — their imbalance — shows France's banking system more exposed to Italian debtors by about $365.8 billion. The risk to countries’ debts and economies is indicated by color:
Tomi.