
Google Maps API links. Demo Gallery - Google Maps API. Fusion Tables. Maps - Fusion Tables Help. How to Create a Google Map With Excel Data and Fusion Tables. Visualizing data as circles in Google Maps. Datasets that include geographic or spatial data (“geodata”) are often much easier to digest on a map.

When each data point also includes a measure of size or catchment, it could be helpful to represent the point as a circle on the map, with the radius indicating its relative size. Here’s an example showing the UK car industry, which was created using the Google Maps API (screenshot): Source (zip) – all data is fictitious; runs locally in IE Notice that the circle radius (number of employees) and colour (status) are used to represent different aspects of each car plant. This makes use of the latest Google Maps API (v3), which includes the ability to draw overlays. The body of the HTML is just a single DIV element: The rest is all javascript. Loading the XML file We can use jQuery’s .ajax() method to load the XML file, followed by calls to .find() and .each() to iterate over the elements. Close your eyes for a second :-) function toXmlDom(data) {if (typeof data !
Displaying the map. Interactive Map Samples Showcase - iMapBuilder Online, online map application, web based map application, interactive map, custom maps solution based on Google Maps, online Google Map builder, Google Map editor, clickable map, world map, image map, image. Google Maps created by GMap Editor or from custom map solution.
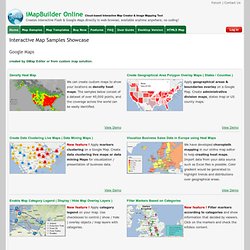
Density Heat Map View Demo We can create custom maps to show your locations as density heat maps. The samples below consist of a dataset of over 40,000 points, and the coverage across the world can be easily identified. Census Data and Demographics Map View Demo Using shape files of administrative divisions like states or provinces, or statistical regions like census tracts or regions, and overlay them on a base Google Map Suitable for sales and business data analysis US States Overlay on Google Maps View Demo Google Maps would show state and province borders, but they are not customizable. Central Paris Map with Scattered Placemarks View Demo Plotting of placemarks according to longitude & latitude values (GPS coordinates) Data driven with location and information box content drawn from an uploaded CSV file Suitable for visualizing members locations, facilities & branches Rally Map across Provinces of Nigeria.
Google Maps API Tutorial. If you happen to have your data stored in some application that doesn't export XML files, you might prefer to output it as a plain text file.

It's also possible to have an script running on your server which returns plain text data containing a different selection from the data depending on query information derived from what your users input. I'm not going to cover the server side of things in this tutorial. Here's a simple example You can see the file that I used here The code defines a function "process_it()" which processes the retrieved data. The entire data file is passed to process_it() as a single string, which we can then split into lines using newline (\n) as a separator.