
Advanced Analytics, Cyber Capabilities, Tactical Mobility Solutions for National Security. Linnaeus University Centre for Data Intensive Sciences and Applications. In today's society sensors, computers, communication platforms and storage technologies give us access to previously unmanageable volumes of data, so-called Big Data.
The conversion of data into actionable knowledge creates new opportunities and significant economic values. Socioeconomic Data and Applications Center. Home - M-Lab. Home - M-Lab Viz. Creativecoding.soe.ucsc. Big Data Management, Analysis, and Visualization. ViDA NYU - Visualization and Data Analytics. M⁴ Competition – The M⁴ (Makridakis 4) Forecasting Competition. Institute: Visualisierungsinstitut der Universität Stuttgart. The Visualisation Research Centre (VISUS) is a central institution of the University of Stuttgart.
About 30 scientists are doing research in different areas of scientific visualisation, Visual Analytics, Visual Computing and Computer graphics, as well as interdisciplinary, applied research. The latter results in a very close co-operation with non-visualisation disciplines of the University of Stuttgart. As part of the Institute for Visualisation and Interactive Systems (VIS), the insitute is embedded into the Faculty of Computer Science, Electrical Engineering and Information Technology. There is a close co-operation to the other departments of VIS. The academic staff is involved into the teaching programme for computer science and Ssoftware engineering.
Data Therapy – tips for empowering people with data from Rahul Bhargava at the MIT Center for Civic Media. Cultural Analytics Lab. Stanford Future Data Systems Research Group. Recruit Institute of Technology. HCIL. UC Berkeley. OCAD UNIVERSITY. The Visual Analytics Lab (VAL) is focused on innovation and training in information, and scientific visualizations and visual analytics.
Driven by the increasing complexity of data sets and the need for visualization of both data and information the VAL’s team of researchers, designers, artists, cultural theorists, graphics specialists and software developers, invent new visual metaphors, create analysis algorithms, deliver prototypes and research outcomes that strive to make complex data meaningful by skilful visual designs, compelling interaction, sound analytic methods, and solid engineering.
The VAL collaborates with local experts, international and industry partners with projects that span urban and transportation issues, financial and health care services, publishing, social media and the entertainment sector. The goal of OCAD University’s visual analytics lab is to research: VAL’s research and development activities focus on four main areas: Visual Analytics Benchmark Repository. About Us The repository: The Visual Analytics Benchmarks Repository contains resources to improve the evaluation of visual analytics technology.
Benchmarks contains datasets and tasks, as well as materials describing the uses of those benchmarks (the results of analysis, contest entries, controlled experiment materials etc.) Most benchmarks contain ground truth described in a solution provided with the benchmark, allowing accuracy metrics to be computed. SEMVAST. News The old server that hosted the Repository died... so it was moved HERE: the new version of the Visual Analytics Benchmark Repository .
The original websites for a few older challenges also ran on now-outdated technology and stopped working, so we saved PDF copies of the pages and include them in the benchmark repository for archival purposes. The VAST Challenge 2014 was a success. The solutions and all entries will be posted soon on the Visual Analytics Benchmark Repository Look at the Information Visualization journal special issue on the VAST challenge (Oct 2014) Read the summary of seven years of VAST Challenge - i.e. our Beliv 2012 paper (PDF - as revised after the workshop) The Blog was closed (too high ratio of spam postings to real news).
Subscribe to our MAILING LIST to receive emails about this topic (only a couple a month maximum) We posted a sample IRB application for running a MILC study (Multi-Dimensional In-depth Long-term Case study) Participants Project Description. Visual Analytics. Home - Graphics, Visualization, & Interaction Group. VRL Brown University: VRL Homepage. Center for Government Excellence - Johns Hopkins Center for Government Excellence. Big Data Institute. Data Science Courses. Welcome — Oxford Big Data Institute. GiCentre. The Govlab. DataVis.ca. Information Design and Visualization at Northeastern University. Center for Digital Humanities and Computational Social Science.
{*style:<ul>*}{*style:<li>*}{*style:<h3>*}{*style:<a href=' Co-Director Elizabeth Dillon featured in the New York Times{*style:</a>*}{*style:</h3>*} November 24, 2016 {*style:<br>*}Professor Elizabeth Maddock Dillon recently published an op-ed, “Long Before ‘Hamilton’ Brouhaha, Theater Was Anything but Polite” in the New York Times.
You can read her ... {*style:<a href=' more... The Alan Turing Institute. Computer Graphics at Stanford University. InfoVis Group @ UBC Computer Science. 06/2016 [talks]: Information+ Keynote, Lightning Talks Tamara Munzner gave a keynote talk entitled Visualization Analysis and Design at Information+, June 16 - 18, 2016 in Vancouver BC, Canada.

Also at Information+, recent group alum Johanna Fulda gave a lightning talk entitled What’s up with Data Journalism in Canada? And visiting PhD student Georges Hattab gave a lightning talk on A Mnemonic Card Game for your Amino Acids, which also appeared in the Information+ Exhibition at Emily Carr University of Art + Design. [conference website + registration details] University of Maryland, Human-Computer Interaction Lab. INTERACT 2013 v7. Visual Storytelling Institute.
MIT Living Lab. Welcome to Big Data at CSAIL. MASSVIS - Massachusetts (Massive) Visualization Dataset. Software Studies Initiative. Ncva.itn.liu.se: Linköping University. Nu på Svenska!
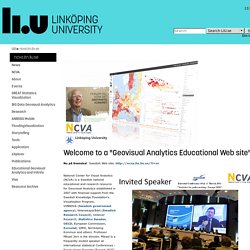
Swedish Web site: National Center for Visual Analytics (NCVA) is a Swedish national educational and research resource for Geovisual Analytics established in 2007 with financial support from the Swedish Knowledge Foundation's Visualization Program, VINNOVA (Swedish government agency), Vetenskapsrådet (Swedish Research Council), Unilever Research, Statistics Sweden, OECD, European Commission, Eurostat, SMHI, Norrköping Kommun and others. Professor Mikael Jern is the director. Mikael is a frequently invited speaker at international statistical Conferences - figure shows Eurostat "Europé 2020" Conference.
IBM Center for the Business of Government: Research, Trends, Reports. The Use of Data Visualization in Government. Monday, June 10th, 2013 - 10:26 The concept of visualization recalls a pivotal scene in the movie A Beautiful Mind which showed the protagonist, mathematician John Nash, looking at an expansive table of numbers.
Slowly, certain numbers seemed to glow, suggesting that Nash was perceiving a pattern among them, though no other researcher had been able to draw any meaning from the table. For most people, however, a table of numbers is not intrinsically meaningful. Think of the most prosaic example: a spreadsheet. Since their early days, spreadsheet applications have offered tools that allow users to create graphics of all sorts from their tables, the better for people to understand exactly what the data are showing. The best visualizations help viewers understand not only the data, but also their implications.
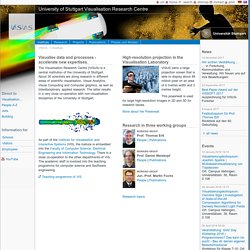
The report presents case studies on how visualization techniques are now being used by two local governments, one state government,and three federal government agencies. Institute: Visualisierungsinstitut der Universität Stuttgart. The Visualization Research Center (VISUS) is a central institution of the University of Stuttgart.
About 30 scientists research in different areas of Scientific Visualization, Visual Analytics, Visual Computing and Computer Graphics, as well as interdisciplinary, applied research. The latter results in a very close co-operation with non-visualization disciplines of the University of Stuttgart. As part of the Institute for Visualization and Interactive Systems (VIS), the insitute is embedded into the Faculty of Computer Science, Electrical Engineering and Information Technology. There is a close cooperation to the other departments of VIS. The academic stuff is involved into the teaching program for Computer Science and Software Engineering.
Teaching program of VIS. Main / HomePage. MIT Senseable City Lab. Strava Labs. DataVis.ca. UW Interactive Data Lab.