
How the Victorians Mapped London’s Cholera – Spatial.ly. It is, of course, John Snow who is credited with using maps to demonstrate that the clusters of deaths from cholera in London’s Soho during London’s 1854 outbreak were caused by contaminated water.
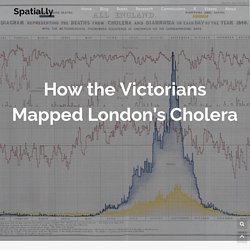
This marked a major shift in thinking away from the disease being transmitted through dirty air: the more widely accepted theory at the time. However, it wasn’t just Snow producing innovative maps and charts to support his cause. Snow was part of an arms race to get the best data communicated by the most compelling maps/ charts, to evidence his side of the debate against his contemporaries – people like William Farr who was also a master data visualiser. The Wellcome Collection’s image catalogue contains many great examples of maps and charts produced around the 1850s . These images are high resolution and free to use under a CC-BY 4.0 license. The periodic table is 150 years old this week - The history of science. 3rd Wave Data Visualization. Byrne’s Euclid.
The Map That Helped Convince Lincoln Slavery Had To End. A Spreadsheet Way of Knowledge — Backchannel. I learned, belatedly, that last October 17 was Spreadsheet Day, marking the 35th anniversary of VisiCalc, the Apple II program that started it all.
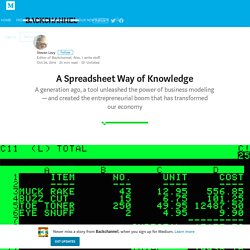
This moved me to republish a long piece I wrote 30 years ago about the significance, as well as the dangers, of this advance. (This was so long ago that I had to define what a cursor was!) The piece first appeared in Harper’s, November 1984. As Dan Bricklin remembers it, the idea first came to him in the spring of 1978 while he was sitting in a classroom at the Harvard Business School. It was the kind of idea—so obvious, so right— that made him immediately wonder why no one else had thought of it. 1812. Interacting with DataViz History – info we trust.
This is about the making of a full screen interactive that lets you explore the first 300 years of data visualization.
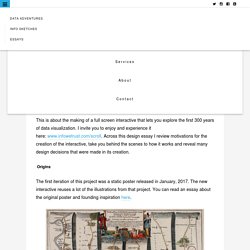
I invite you to enjoy and experience it here: www.infowetrust.com/scroll. Across this design essay I review motivations for the creation of the interactive, take you behind the scenes to how it works and reveal many design decisions that were made in its creation. Origins The first iteration of this project was a static poster released in January, 2017. The new interactive reuses a lot of the illustrations from that project. History of Infographics. W.E.B. Du Bois’s Little-Known, Arresting Modernist Data Visualizations of Black Life for the World’s Fair of 1900. On a recent research visit to the Emily Dickinson museum and archives in Amherst, I chanced upon a most improbable discovery of forgotten, pioneering work by another titan of culture. When thirty-one-year-old W.E.B.
Du Bois (February 23, 1868–August 27, 1963) heard that the World’s Fair to be held in Paris in 1900 would include a special exhibition on the subject of sociology, he saw in it an opportunity to open the world’s eyes to what had been occupying him for nearly a decade — “the American Negro problem.” In The Autobiography of W.E.B. Search Results: ""lot 11931" NOT medal" - Prints & Photographs Online Catalog. Minard map in D3. This is a demo of how my trail layout for D3 can reproduce Minard's map of the retreat of Napoleon's army from Russia.
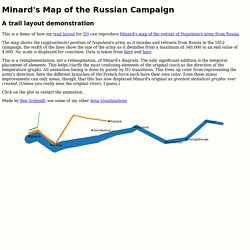
The map shows the (approximate) position of Napoleon's army as it invades and retreats from Russia in the 1812 campaign; the width of the lines show the size of the army as it dwindles from a maximum of 340,000 to an end value of 4,000. No scale is displayed for concision. Data is taken from here and here This is a reimplementation, not a reimagination, of Minard's diagram. The only significant addition is the temporal placement of elements. Napoleon's March to Moscow. Our Memories of Hans Rosling. We are sad to report that Hans Rosling, a friend and teacher we both admired a great deal, died February 7.
He was 68 years old. Like many people, we first became aware of Hans when he gave a mind-blowing TED talk in 2006. This is how we let Hans Rosling rest in peace - HD. Hans Rosling was said to be unable to deliver bad news.

That is a misconception. Three years before passing away, he remarked that the one thing that had surprised him the most during his tenure as a global educator was that he became so famous – despite having so little influence over people’s real knowledge. He realized he was stuck in ”persona hell”, and that people remained ignorant at a level worse than random guessing when they took Gapminder’s tests. Not because of a lack of knowledge, but because of ”an actively upheld ignorance”. Plotly Blog - How To Analyze Data: Seven Modern Remakes Of The... Graphs can be beautiful, powerful tools.
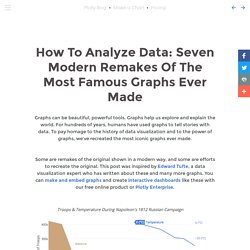
Graphs help us explore and explain the world. For hundreds of years, humans have used graphs to tell stories with data. To pay homage to the history of data visualization and to the power of graphs, we’ve recreated the most iconic graphs ever made. Some are remakes of the original shown in a modern way, and some are efforts to recreate the original. Gallery of Data Visualization - Historical Milestones. Florence Nightingale's Coxcomb diagrams Coxcomb, original (537x462) [37K] || SAS re-creation (486x501) [5K] Florence Nightingale (portrait [41k]) is remembered as the mother of modern nursing.
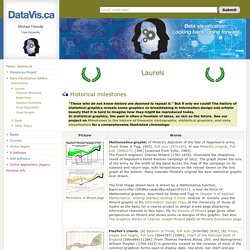
But few realize that her place in history is at least partly linked to her use, following William Farr, Playfair and others, of graphical methods to convey complex statistical information dramatically to a broad audience. After witnessing deplorable sanitary conditions in the Crimea, she wrote Notes on Matters Affecting the Health, Efficiency and Hospital Administration of the British Army. (1858), an influencial text including several graphs which she called "Coxcombs". This figure (reproduced with SAS/Graph) makes it abundantly clear that far more deaths were attributable to non-battle causes ("preventable causes") than to battle-related causes. Aside from its historical interest, Nightingale's Coxcomb is notable for its display of frequency by area, like the pie chart. Napoleon's March to Moscow: The War of 1812Map representing the losses over time of French army troops during the Russian campaign, 1812-13.
100yrs of Data Visualisation best practice. XYZ Contents. Dynamic queries, starfield displays, and the path to Spotfire. Ben Shneiderman, February 4, 1999 Updated July 26, 2007 Updated February 27, 2015 (Catherine Plaisant added mention of the cancer atlas prototype) The old days of command line interfaces and submitting queries to databases are passing quickly.
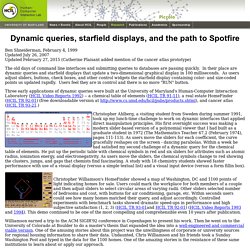
In their place are dynamic queries and starfield displays that update a two-dimensional graphical display in 100 milliseconds. As users adjust sliders, buttons, check boxes, and other control widgets the starfield display containing color- and size-coded points us updated rapidly. Users feel they are in control and there is no more "RUN" button. Stunning Data Visualizations. The geology of the US, with sumptuous hand-shading that puts most computer-generated maps to shame: Here's a map of different national origins: In the fiscal chart below, a lot of history is illustrated using data:
How the Bit Was Born: Claude Shannon and the Invention of Information. “All things physical are information-theoretic in origin and this is a participatory universe… Observer-participancy gives rise to information,” the pioneering theoretical physicist John Wheeler asserted in his visionary It for Bit concept in 1989. But what exactly is the bit, this elemental unit of participatory sensemaking, and how did it come to permeate our consciousness?
That’s what James Gleick examines in a portion of The Information: A History, a Theory, a Flood (public library) — his now-classic chronicle of how technology and human thought co-evolved, which remains one of the finest, sharpest books written in our century, full of ideas fertilized by the genius of a singular seer and incubated in the nest of time and culture into ever-growing prescience. The story of the bit began in 1948, when Bell Labs invented the transistor — a technology that would go on to earn its inventors the Nobel Prize and alter nearly every aspect of modern life. Gleick writes: Gleick explains: The Repetitive and Boring History of Visualization – eagereyes. When people talk about the history of data visualization, the same set of names always comes up: Playfair, Nightingale, Snow, Minard.
They are historically important, alright, but why do they overshadow all the other work that was done? And what do we know about how important they actually were? The Usual Suspects They’re like old friends. Understanding Uncertainty. Through her work as a nurse in the Crimean War, Florence Nightingale was a pioneer in establishing the importance of sanitation in hospitals. She meticulously gathered data on relating death tolls in hospitals to cleanliness, and, because of her novel methods of communicating this data, she was also a pioneer in applied statistics. We explore the work of Nightingale, and in particular focus on her use of certain graphs which, following misreading of her work, are now commonly known as 'coxcombs'. Fifty Years of Databases – ACM SIGMOD Blog. Fifty years ago a small team working to automate the business processes of the General Electric Low Voltage Switch Gear Department in Philadelphia built the first functioning prototype of a database management system.
The Integrated Data Store was designed by Charles W. Bachman, who later won the ACM’s Turing Award for the accomplishment. He was the first Turing Award winner without a Ph.D., the first with a background in engineering rather than science, and the first to spend his entire career in industry rather than academia. The exact anniversary of IDS is hard to pin down.
Detailed functional specifications for the system were complete by January 1962, and Bachman was presenting details of the planned system to GE customers by May of that year. “This guy’s arrogance takes your breath away” 39 studies about human perception in 30 minutes. Infographics in the Time of Cholera. The Dataviz Pioneer You've Never Heard of. 8 Inspirational Data Visualizations to Get You Through the Day. Datavis.ca - Papers. History of Data Visualization. Visualization Milestones. DataArt - Learning Resources. Minard: Napoleon's Retreat From Moscow (Russian Campaign 1812-1813) Nightingale's 'Coxcombs' Beginner's Guide to the History of Data Science. John McCarthy - A.M. Turing Award Winner. Ivan Sutherland - The 1988 A.M. Turing Award Winner. Milestones in the History of Thematic Cartography, Statistical Graphics, and Data Visualization.