
Microsoft SharePoint Designer Team Blog : DataViews + Visifire =Silverlight Charting Power. Hi everyone, Jon here again with a great tip on visualizing your data.

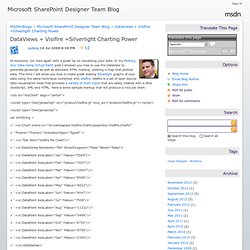
In my Plotting Your Data Using Virtual Earth post I showed you how to use the DataView to generate javascript as well as standard HTML markup, yielding a map that plotted data. This time I will show you how to make great looking Silverlight graphs of your data using the same technique combined with Visifire. Visifire is a set of open source data visualization tools that provides a variety of chart types that are easily created with a little JavaScript, XML and HTML. Sharepoint Silverlight Image & Video Browser.