
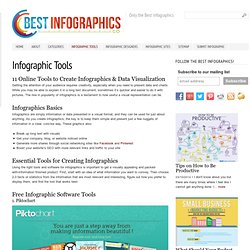
Information Graphics & Data Visualization. 11 Free & Paid Online Tools to Create Infographics & Data Visualization. 11 Online Tools to Create Infographics & Data Visualization.
Education Infographics by Knewton. Dipity - Find, Create, and Embed Interactive Timelines. Online Graphing Examples. 20 Powerful Infographic Design Kits. 14 Web Tools Teachers Should Try This School Year. Capture great ideas, photos, recordings, or just about anything else on your Evernote account, access it anywhere, and keep it organized.
A must-have tool for lesson planning. There are so many ways Twitter can be used in education. Teachers can connect with other educators, take part in chats, share their ideas, or even use it in the classroom to reach out to students.Google Education: Google offers a number of great edtech resources for teachers, including email and collaborative apps, videos, lesson plan search, professional development, and even educational grants. 10 Excellent Platforms to Create your Classroom Website and Blog. There are several web platforms that allows users to easily create their website in a matter of minutes.

We have handpicked a list of the most popular platforms to start with. Check them out below and if you have other suggestions, share them with us in the comment form below. Enjoy Platforms to create websites for your class 1- Google Sites This is by far our favourite and anyone with a Google account have access to it. 2- Weebly for Education This is another popular platform for creating websites.
4 Tools for Building Academic Vocabulary. “4 Tools for Building Academic Vocabulary” by Susan Oxnevad was originally published on gettingsmart.com There is a wealth of research to suggest that vocabulary knowledge is the single best predictor of student academic achievement across all curriculum areas.

Experts agree, if given the opportunity to receive effective vocabulary instruction, most students can acquire vocabulary at rates that will improve their comprehension and also their chances for success in school. Even the Common Core identifies Academic Vocabulary as one of the six big shifts. It’s clear that educators need to spend some time teaching. Why Vocabulary and Tech? Technology is an effective and engaging tool that can be used to improve vocabulary acquisition for all learners and engage them in the learning process. 1. Wallwisher is a free and user friendly digital tool that allows users to create a digital wall of multimedia sticky notes which can include text, images, links and videos. 13 Of The Best Tools To Create Infographics. For better or for worse, visual information is the new internet, and infographics are pioneers in mashing information and images together in a way that hopefully tells a story, provides utility, or both.
46 Tools To Make Infographics In The Classroom. Infographics are interesting–a mash of (hopefully) easily-consumed visuals (so, symbols, shapes, and images) and added relevant character-based data (so, numbers, words, and brief sentences).
The learning application for them is clear, with many academic standards–including the Common Core standards–requiring teachers to use a variety of media forms, charts, and other data for both information reading as well as general fluency. It’s curious they haven’t really “caught on” in schools considering how well they bridge both the old-form textbook habit of cramming tons of information into a small space, while also neatly overlapping with the dynamic and digital world. Animaps. Animaps. Knowledge Apps: Using the Computable Document Format (CDF) Textbooks: Using the Computable Document Format (CDF) Infographics and Blogs: Using the Computable Document Format (CDF) Infographics from KISSmetrics - Marketing Resources for SaaS & eCommerce.
How To Create Outstanding Modern Infographics. In this tutorial you will learn that data doesn't have to be boring, it can be beautiful!

Learn how to use various graph tools, illustration techniques and typography to make an accurate and inspiring infographic in Adobe Illustrator. Start by using the Rectangle Tool (M) to draw a shape. Give it a subtle radial gradient too. The entire design is based on a grid of four columns. To make the columns first select the rectangle and drag a guide onto the centre of the shape.
Condense the shape so it fits within the left-most guide and centre guide. Move the shape over to the right and add another guide to the centre here. Using the Rectangle Tool (M) draw a thin white box on the centre line that will be the width of the gap between the columns. Repeat the process for the other columns with your final result being below.
Over 100 Incredible Infographic Tools and Resources (Categorized) This post is #6 in DailyTekk’s famous Top 100 series which explores the best startups, gadgets, apps, websites and services in a given category.

Total items listed: 112. My 5 Best Social Media Tips For Teachers. Here in the U.S., it’s nearly time to head back into the classroom and to once again mold young minds.

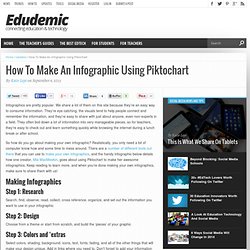
Teachers are organizing their thoughts, figuring out what they learned at all the summer conferences like ISTE, and putting together lessons that will set the world on fire. That’s the idea at least. How To Make An Infographic Using Piktochart. Infographics are pretty popular.
Infographic: Why should companies hire interns? Jane Birkin.