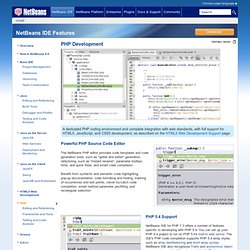

IDE - PHP Development. A dedicated PHP coding environment and complete integration with web standards, with full support for HTML5, JavaScript, and CSS3 development, as described on the HTML5 Web Development Support page.

Powerful PHP Source Code Editor The NetBeans PHP editor provides code templates and code generation tools, such as "getter and setter" generation, refactoring, such as "instant rename", parameter tooltips, hints, and quick fixes, and smart code completion. Benefit from syntactic and semantic code highlighting, pop-up documentation, code formating and folding, marking of occurrences and exit points, clever try/catch code completion, smart method parameter pre-filling, and rectangular selection.
Debugging PHP Source Code in the NetBeans IDE for PHP Editor. Contents To follow this tutorial, you need the following software and resources.

Getting Ready. View topic - Sticky Notes: Setting Up Zend Debugger. This Sticky Note explains how to set up Zend Debugger on Linux.

The procedure applies to most distributions with PHP (and Apache) installed. For most steps you will probably need the superuser account. 1. Inspect the phpinfo() output of the server on which you want to install the Zend Debugger (or run php -i if you want to install Zend Debugger for the CLI version of PHP).Click on the picture to see it without scroll bars: phpinfo() after the installation pre-a.png (130.04 KiB) Viewed 83369 times You need the following information:(1) The PHP version (PHP CLI - PHP Version => 5.2.9),(2) The location of the php.ini file (PHP CLI - Loaded Configuration File => /etc/php5/cli/php.ini), or(3) The additional .ini files directory (PHP CLI - Scan this dir for additional .ini files => /etc/php5/conf.d). 2.
Solving cron problems. Various things can keep cron from doing its job on your Drupal site.

If your Status report (admin/reports/status) indicates that cron hasn't run recently, try the following to diagnose and fix the problem: Make sure cron.php is being called at all If your Status report indicates that cron has never run, you may simply need to configure configure a cron job. If you can successfully run cron manually from your Status report screen, Admin menu, or Drush, this is almost certainly the case. If manually running cron fails, you have a deeper problem... How To Setup a Free PHP Debugger using Eclipse PDT + XDebug. When I debug code, I find that a debugger is a very powerful tool.

With a debugger you can set breakpoints, step through code, watch variables, do a stack trace, and much, much more. The eclipse PDT + XDebug offers a PHP debugger that you can use for free. It also offers a full PDT IDE (for editing, “building”, and debugging your PHP projects), but I use eclipse+PDT+XDebug only as a debugger since I like to use my favorite editor for editing. This guide shows how to setup eclipse+PDT+XDebug as your PHP Debugger. This guide was written and tested using the R20080603 – 1.0.3 PDT all in one package. I haven’t used this debugger much yet as I have only gotten to set it up. One of the limitations I’ve found is that for the first page you navigate to, it seems that you can’t specify what is to be given in the “POST” data of the webpage.
Christophe Le Bot » Configurer Xdebug pour Eclipse PDT en utilisant un serveur de test distant. Fini le développement web approximatif !

Aujourd’hui, les applications web deviennent de véritables usines à gaz qu’il faut savoir maîtriser. Certains regrettent l’époque du développement procédural avec ses projets de moins de 2000 lignes de code, mais il faut se rendre à l’évidence : le web est la plate-forme, il a besoin d’applications riches, complexes et stables. Un exemple, Magento : 300.000 lignes de code… Sans outils d’aide au développement, il n’est plus possible de garantir la qualité de son code. PHP Development Tools (PDT) - Downloads. Introducing xdebug. By: Stefan Priebsch Other Articles in the Series Part One: Introducing xdebugPart Two: Tracing PHP Applications with xdebugPart Three: Profiling PHP Applications With xdebugPart Four: Debugging PHP applications with xdebugPart Five: Creating Code Coverage Statistics with xdebug This article is the first installment of a five-part series of articles covering xdebug, a free and open source swiss army knife tool for PHP developers.xdebug is a PHP extension created by Derick Rethans, one of the PHP core developers.

This week, we will show you how to install xdebug and introduce you to some of the basic features. In the subsequent parts of this article series, we will have a closer look at one of xdebug’s main features, namely tracing, profiling, debugging, and code coverage. Installing the xdebug extension. For Windows: XDebugGuideForPDT2.0.pdf (Objet application/pdf) Debugging PHP applications with xdebug. By: Stefan Priebsch Other Articles in the Series.

Documentation. XDEBUG EXTENSION FOR PHP | DOCUMENTATION » The full documentation » Installation This section describes on how to install Xdebug. » Basic Features Xdebug's basic functions include the display of stack traces on error conditions, maximum nesting level protection and time tracking. » Variable Display Features.
